IGARSS 2011
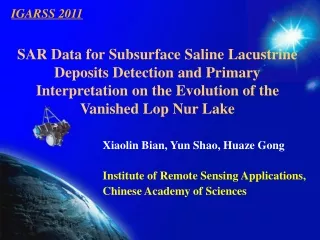
IGARSS 2011. SAR Data for Subsurface Saline Lacustrine Deposits Detection and Primary Interpretation on the Evolution of the Vanished Lop Nur Lake. Xiaolin Bian, Yun Shao, Huaze Gong Institute of Remote Sensing Applications, Chinese Academy of Sciences. Introduction


IGARSS 2011
E N D
Presentation Transcript
IGARSS 2011 SAR Data for Subsurface Saline Lacustrine Deposits Detection and Primary Interpretation on the Evolution of the Vanished Lop Nur Lake Xiaolin Bian, Yun Shao, Huaze Gong Institute of Remote Sensing Applications, Chinese Academy of Sciences
Introduction Field Works and Analysis Polarimetric Analysis and Results Multi-source SAR Data Analysis and Interpretation Conclusion Outline
Introduction TM RADARSAT-1 ALOS-PALSAR
Introduction • located in east Tarim Basin in Xinjiang Uygur Autonomous Region, northwest China • 5350 km2 as reported • less than 20 mm annual precipitation, over 3000 mm or more evaporation……. “Drought Pole” • Concentration center for mineral salts • famous Earth “Ear” Pattern
Introduction combination Polarimetric technology Penetration ability for SAR Lop Nur penomenon
Field Works and Analysis Field investigation routes and sampling pit locations. (A, B and C are field routes in 2006 in black line; I、II and III are field routes in 2008 in blue line; red dots are sampling locations of 2008 field trip, which are mainly analyzed in this report.)
Field Works and Analysis B A Sample collection at sampling sites located on the bright strip (A) and dark strip (B) on SAR images. • Total 5 field trips,520 samples • 6 lacustrine deposits samples were collected for each sampling site from surface to bottom of each sampling pit at different depths • Moisture, ion content, particle size, PH value, dielectric constants.
Field Works and Analysis Moisture Moisture variation from surface to bottom of the lacustrine deposits at selected sampling pits
Field Works and Analysis Subsurface scattering mechanism illustration
Polarimetric Analysis and Results The co-polarization correlation Co-polarization correlation analysis for bright and dark region (Length of radius is co-polarization correlation coefficient; scattered angle of circumference stands for phase differences.)
Polarimetric Analysis and Results Degree of Polarization Degree of polarization for bright and dark regions
Polarimetric Analysis and Results Degree of Polarization (PMax, p) of bright and dark region (The dot and dash line means boundary of different regions randomly.)
Polarimetric Analysis and Results Shannon entropy (latest) Shannon entropy for bright and dark regions
Polarimetric Analysis and Results Shannon Entropy Shannon entropy is a sum of two contributions related to intensity and polarimetry. HH, VV and HV polarization amplitude maps of RADARSAT-2data Shannon entropy and its intensity, polarimetric contributions maps
Polarimetric Analysis and Results Polarimetric decomposition Polarimetric decomposition results in single scattering, dihedral scattering and multiple scattering with Cloude decomposition based on ALOS-PALSAR data.
Polarimetric Analysis and Results Polarimetric decomposition Comparison of multiple scattering component of Cloude decomposition and salinity of subsurface medium, where R Square and standard deviation are also shown.
Polarimetric Analysis and Results Retrieved Salinity of subsurface lacustrine deposits based on the Cloude decomposition. It is found that subsurface salinity can well express the image feature of Lop Nur Lake shorelines, which indicates salinity making significant contribution to backscattering intensity on SAR image.
Polarimetric Analysis and Results RADARSAT-1 image (1999) and TM image (1997)
Polarimetric Analysis and Results Interpretation map of Lop Nur Lake and other targets based on SAR images
Conclusion • Based on analysis on physical and chemical properties of lacustrine deposits, the subsurface scattering structure of the Lop Nur was proposed in this report. • Physical scattering mechanism of bright and dark regions with different image texture in Lop Nur Lake was analyzed with polarimetric parameters including co-polarization correlation and degree of polarization.
Conclusion • There are three important scientific findings in this study. • The total area of the vanished Lop Nur Lake is more than10,000 km2, much larger than 5350 km2 as reported. • The relatively younger West Lake is superposed on the top of the lacustrine deposits of East Lake, so the Lop Nur Lake actually has nearly circular, closed shorelines. • The drying-up process of East Lop Nur Lake went through 6 phases according to the shorelines interpreted from multiple SAR data.
Conclusion • Other polarimetric parameters, such as Shannon Entropy, can provide more information, and there needs certain physical explanation. Future focus