Download
1 / 8
STAT 101: Statistics for Behavioral Sciences - Interactive PowerPoint Presentation
80 likes | 104 Vues
This interactive PowerPoint presentation is an example of a graphical syllabus for F12-EDUC485/685/COMM486-PCS. It covers the course structure, objectives, probability, scatter plot, skewness, ANOVA, assignments, due dates, and final exam details.
Télécharger la présentation 
STAT 101: Statistics for Behavioral Sciences - Interactive PowerPoint Presentation
An Image/Link below is provided (as is) to download presentation
Download Policy: Content on the Website is provided to you AS IS for your information and personal use and may not be sold / licensed / shared on other websites without getting consent from its author.
Content is provided to you AS IS for your information and personal use only.
Download presentation by click this link.
While downloading, if for some reason you are not able to download a presentation, the publisher may have deleted the file from their server.
During download, if you can't get a presentation, the file might be deleted by the publisher.
E N D
Presentation Transcript
SudhaAravindanMultimedia Project for F12-EDUC485/685/COMM486-PCS (Dr. Fred Hofstetter)This is an interactive PowerPoint presentation as an example for a graphical syllabus
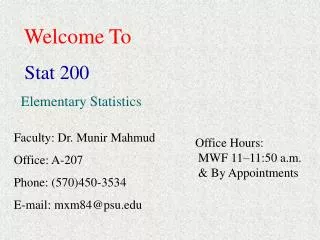
Statistics for the Behavioral Sciences Frederick J. Gravetter, Larry B. Wallnau Optional Optional Text Office hours: 101 Pratt Hall By Appointment
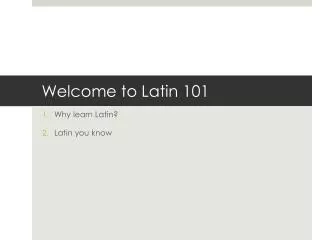
Objectives Probability Scatter Plot Skewness, Anova
Assignments & Due Dates Finals November 28, 2012


More Related