
1. Introduction
Detecting the Signature of Glaciogenic Cloud Seeding in Orographic Snowstorms in Wyoming Using the Wyoming Cloud Radar. Bart Geerts a , Yang Yang a , and Qun Miao b a Department of Atmospheric Science, University of Wyoming, Laramie, Wyoming 82071, USA

1. Introduction
E N D
Presentation Transcript
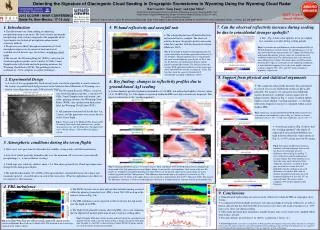
Detecting the Signature of Glaciogenic Cloud Seeding in Orographic Snowstorms in Wyoming Using the Wyoming Cloud Radar Bart Geertsa, Yang Yanga, and Qun Miaob a Department of Atmospheric Science, University of Wyoming, Laramie, Wyoming 82071, USA b Department of Applied Mathematics, Ningbo University, Ningbo Zhejiang, 315211, PR China This poster summarizes the paper Geerts, B. and co-authors, 2010: An airborne profiling radar study of the impact of glaciogenic cloud seeding on snowfall from winter orographic clouds. J. Atmos. Sci., 67, 3286–3302) NWR Impact Award Winner 2012 UCOWR / NIWR CONFERENCE Santa Fe, New Mexico, 17-19 July 7. Can the observed reflectivity increase during seeding be due to coincidental stronger updrafts? • 1. Introduction • The effectiveness of cloud seeding in enhancing precipitation remains uncertain. The level of noise in naturally precipitating cloud systems compared to the magnitude of the signal makes verification of precipitation enhancement extremely difficult. • Progress is most likely through measurements of cloud microphysical processes by means of instruments not available several decades ago, for instance an airborne cloud radar. • The aircraft, the Wyoming King Air (WKA), carried in situ cloud microphysics probes and a sensitive 94 GHz (3 mm) Doppler radar with zenith-and nadir-pointing antennas, the Wyoming Cloud Radar (WCR). The profiling radar has a resolution of ~30 m, adequate to capture turbulence. 5. W-band reflectivity and snowfall rate 6. Key finding: changes in reflectivity profiles due to ground-based AgI seeding • The relationship between W-band reflectivity and snowfall rate is complex. The observed relation (from in situ particle probes and nearby radar data) matches with the theoretical relation (Matrosov 2007). • NO – Fig. 6 shows that updrafts are in fact slightly less common or weaker during seeding periods. Fig.6: Seed minus no-seed difference of the normalized FADs of WCR hydrometeor vertical velocity for all flight passes over the legs downwind of the AgI generators on 7 flights. The black solid and dashed line indicate average values for seed and no-seed conditions respectively. The vertical green line is the observed mean fallspeed for 7 flights. The brown lines are FAD contours based on all 114 passes (seed and no-seed conditions combined), at three different frequency levels: the outer, middle, and inner contours comprise 90%, 60%, and 30% of the cumulative frequency, respectively. Fig. 4: Scatterplot of flight-level precipitation rate (S) against near-flight-level radar equivalent reflectivity (Z) for all flights. The precipitation rate is estimated from the snow size distributions given by the (a) 2D-C and (b) 2D-P probes, the hydrometeor density, and the particle terminal fall velocity. The abscissa shows the average WCR equivalent reflectivity in the nearest gate above and below the aircraft, at a range of ~120m. The two lines show the range of theoretical Z-S relationships according to Matrosov (2007) 8. Support from physical and statistical arguments • 2. Experimental Design • A series of five geographically-fixed aircraft tracks was flown repeatedly in winter storms in the vicinity of ground-based AgI generators in the Medicine Bow Mountains of Wyoming, on a total of seven flight days in early 2008 and early 2009. • The composite radar profile data have been partitioned in several ways to see whether the results are physically plausible. For instance, we contrasted close flight legs against distant ones, in-plume sections against out-of-plume sections. Shown in Fig. 7, a more stratified airflow implies a more shallow “seeding signature”, i.e. the high-reflectivity frequency increase is contained within a more shallow PBL. • The Wyoming King Air (WKA), carried in situ cloud microphysics probes, a sensitive 94 GHz (3 mm) Doppler radar with zenith- and nadir- pointing antennas, the Wyoming Cloud Radar (WCR), and a polarization backscatter lidar, the Wyoming Cloud Lidar (WCL) • All generators remained off for the first 1 or 2 hours, and the generators were on for the rest of the 4-hour flight. • A clear dipole is present of enhanced probability of >10 dBZ, and reduced probability of lower values (-2 to 10 dBZ) (Fig. 5c). This dipole is contained within the PBL were AgI ice nuclei are dispersed. This dipole is referred to as the “seeding signature”. Fig.7: Difference in normalized FAD of WCR reflectivity between seed and no-seed conditions (same as Fig. 5c), but for (a) 4 more stable days (Ns=0.7 10-2 s-1) and 3 less stable days (Ns=0.3 10-2 s-1) Fig. 1: Terrain map of the Medicine Bow Range in SE Wyoming. Showing the AgI generator sites, surface measurement sites, and the flight legs. The flight level was 14 kft for all legs, ~600 m above the highest terrain. • A statistical analysis (Fig. 8) shows that the “seeding signature” (the dipole of enhanced & decreased probabilities for high & lower reflectivity values shown in Fig. 5c) is 95% certain not to be by chance. 3. Atmospheric conditions during the seven flights Fig.8: Percentage of differences between randomly selected subgroups that exceeds the observed seed minus no-seed difference (shown in Fig.5c and Fig. 7), for (a) reflectivity and (b) hydrometeor vertical velocity. The white numbers in (a) show the same, not at the bin level but within the same boxes as in Fig.6. In the grey areas there is a more than 10% probability that the seed minus no-seed difference is by chance. Bins with an absolute normalized seed minus no-seed frequency difference of less than 10-5 are shown in black. The green contour comprises 90% of the cumulative data frequency. • Most cases were post-frontal with rather low stability, strong winds, and little baroclinicity. • Low-level clouds generally formed locally over the mountain. All seven cases were naturally precipitating (i.e., it snowed before seeding). • Cloud tops were relatively shallow, about 1.5-4.5km above ground level. Cloud top temperatures changed little during most flights. • The bulk Froude number (Fr=U/NH) of the upstream flow, calculated between the surface and mountain top level , exceeded unity on each of the seven days. (Thus the AgI plumes were likely to be carried over the mountain.) Fig. 5: Normalized FAD (frequency-by-altitude display, Yuter and Houze 1995) of WCR reflectivity for all flight legs down wind of the AgI generators on seven flights, during (a) no-seed (b) seed conditions. Also shown in the two left panels are cumulative normalized frequencies in three boxes near the ground, expressed as a percentage, the mean reflectivity profile and the “data presence”. The difference between the data in (b) and in (a) is shown in (c). The precipitation rate (S) shown in the upper abscissa of (c) and (d) is inferred from S=0.11 Z1.25 (Matrosov 2007). The ratio of the difference (shown in c) to the no-seed frequency (shown in a) is displayed in (d), together with the mean profiles of S. 4. PBL turbulence • The WCR vertical velocity data indicate that turbulent mixing occurred within the planetary boundary layer (PBL), about 500-1000 m deep in the transect shown in Fig. 2(b). • The PBL turbulence can be expected to effectively mix the AgI nuclei over the depth of the PBL. • The flight level generally remains above the PBL, so it is not surprising that the flight-level particle probe data do not reveal any seeding effect. • 9. Conclusions • Ground-based AgI seeding can increase radar reflectivity within the PBL in orographic snow storms. • A comparison between flight-level snow rate and near-flight-level radar reflectivity, as well as theory, indicate that the observed reflectivity increase just above the surface translates to a ~25% increase in snow rate during seeding. • The results presented have limitations, mainly because only seven storms were sampled. More field work is needed. • For more details, go to Geerts et al. (2010), accepted in J. Atmos. Sci. • Acknowledgements: this work was financed by the Wyoming Water Development Commission and the United States Geological Survey, under the auspices of the University of Wyoming Water Research Program. The operation of the AgI generators was supported by the Wyoming Weather Modification Pilot Project, which is funded by the State of Wyoming. Fig.3: Example WKA lidar and in situ data collected along the same flight track aligned with the wind as the one shown in Fig. 2. Panels (c0 and (d) show lidar data. In panel (e), the LWC is derived from a Gerber PVM-100 probe, and the air vertical velocity if from the gust probe. Fig. 2: Example WKA radar data collected along a flight track aligned with the wind over Medicine Bow Peak, on 10 March 2009. The location of the 5 cross-legs (normal to the wind) is shown.


