Download
1 / 25
250 likes | 360 Vues
The GFNORTE 1H07 report highlights significant financial metrics, including a 12% increase in net income and a consistent return on equity (ROE) of 26%. The report indicates a stable net interest margin of 7.3% and a solid performing loan growth of 28%. Additionally, the past due loan ratio improved to 1.5%, supported by a reserve coverage of 141%. This detailed analysis covers performance indicators in income, assets, expenses, and profitability, providing a comprehensive overview of GFNORTE's financial standing during the first half of 2007.

E N D
GFNORTE: 1H07 Results September, 2007
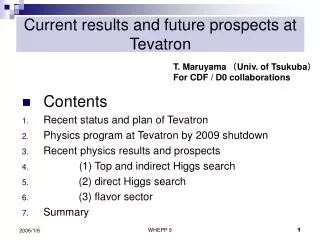
Contents • 1H07 Overview. • Stock Metrics. • Final Considerations.
12% 89% 55% Highlights CONSTANT MILLION PESOS 1H06 1H07 2,938 3,292 Net Income 12% 26% 24% ROE 26.25 49.58 Stock Price 7.6% 7.3% Net Interest Margin 0.75 0.83 EPS P/BV 2.21 3.42 Tax Rate 36% 35% Performing Loan Growth 25% 28% Past Due Loan Ratio 1.6% 1.5% Reserve Coverage 174% 141%
Income Statement CONSTANT MILLION PESOS 1H06 1H07 Change Net Interest Income 7,069 7,843 11% 4,054 3,932 (3%) Non Interest Income Service Fees 2,519 2,760 10% Recovery 587 288 (51%) 947 FX & Trading 883 (7%) 11,123 Total Income 11,775 6% Non Interest Expense (6,288) (6,792) 8% Net Operating Income 4,835 4,983 3% Provisions (839) (987) 18% Non Operating Income (Expense) Net 60 931 1,462% Income Tax (1,472) (1,742) 18% Subsidiaries and Minority Interest 354 108 (70%) Net Income 2,938 3,292 12%
Recurring Net Income CONSTANT MILLION PESOS Non Recurring Recurring 2,196 851 1,675 1,617 1,521 292 1,345 1,325 635 2Q04 2Q05 2Q06 1Q07 2Q07
Non Interest Expense CONSTANT BILLION PESOS 1H06 1H07 Non Interest Expense 6.3 6.8 8% EFFICIENCY RATIO New Accounting Standards + Expansion Program 57% 57% 56% 300bp 54% 1H07 1H05 1H06
Net Interest Margin vs CETES PERCENTAGE Average CETE : 1H05: 9.34% 1H06: 7.36% 1H07: 7.09% 9.7 9.5 9.0 8.6 8.1 8.0 7.9 7.7 7.6 CETES 7.5 7.1 8.5 8.5 8.3 106% 77% 7.5 7.3 7.1 7.1 7.0 7.0 NIM 7.0 6.2 4Q04 1Q05 2Q05 3Q05 4Q05 1Q06 2Q06 3Q06 4Q06 1Q07 2Q07
12% 10% 9% Core Deposits CONSTANT BILLION PESOS YoY Change w/o INB Deposits 2Q05 2Q06 2Q07 Demand 71 83 98 17% 18% Time 40 46 58 14% 28% Total 111 128 156 16% 22% Mix Demand 64% 64% 63% Time 36% 36% 37% 100% 100% 100%
28% 26% 19% Performing Loan Portfolio CONSTANT BILLION PESOS 163 150 128 2Q06 1Q07 2Q07 Change YoY w/o Extras 2Q06 1Q07 2Q07 QoQ YoY Consumer 46 50 54 8% 17% 46 60 63 5% 35% Commercial 22 25 30 19% 36% Corporate 13 15 17 13% 25% Government Total 128 150 163 9% 28%
54 50 46 2Q06 1Q07 2Q07 25% 26% Performing Consumer Loan Portfolio CONSTANT BILLION PESOS YoY Change w/o Extras Change 2Q06 1Q07 2Q07 QoQ YoY 8% 11% Mortgage 27 28 30 3% 5% Car Loans 6 6 7 10% 45% Credit Card 8 10 12 10% 26% Payroll Loans 4 5 6 8% 17% Consumer 46 50 54
Asset Quality CONSTANT BILLION PESOS 2Q06 1Q07 2Q07 Total Loan Portfolio 132 154 168 Past Due Loans 2.0 2.2 2.5 Loan Loss Reserves 3.6 3.3 3.5 PAST DUE LOAN RATIO RESERVE COVERAGE 174% 1.6% 1.5% 149% 1.4% 141% 2Q06 1Q07 2Q07 2Q06 1Q07 2Q07
Capitalization Ratio PERCENTAGE 2Q05 2Q06 2Q07 Tier 1 14.0% 12.7% 10.9% Tier 2 3.3% 2.6% 4.3% TOTAL 17.3% 15.2% 15.2% Percentage Tier 1 81% 83% 72%
Recovery Bank CONSTANT MILLION PESOS 1H05 1H06 1H07 Net Income 362 406 313 ASSETS UNDER MANAGEMENT CONSTANT BILLION PESOS ASSET BREAKDOWN 2Q07 CONSTANT BILLION PESOS Investment Projects 1.3 65 63 62 59 57 Assets 6.2 Banorte 19 25 32 55 55 Portfolio 49.0 46 IPAB 39 30 4 2 2Q03 2Q04 2Q05 2Q06 2Q07 Total: 56.5
Long Term Savings NET INCOME IN CONSTANT MILLION PESOS LONG TERM SAVINGS 408 250 248 1H05 1H06 1H07 AFORE ANNUITIES INSURANCE 82 ROE: 13% ROE: 84% ROE: 19% 256 140 108 45 143 74 33 26 1H05 1H06 1H07 1H05 1H06 1H07 1H05 1H06 1H07
Subsidiaries NET INCOME IN CONSTANT MILLION PESOS BROKERAGE HOUSE OTHER FINANCE COMPANIES ROE: 25% ROE: 32% 122 144 130 102 77 46 1H05 1H06 1H05 1H06 1H07 1H07
INB Results CONSTANT MILLION DOLLARS 1H06 1H07 Net Interest Margin 4.7% 4.5% Performing Loan Portfolio 721 922 28% Deposits 977 1,280 31% Net Income (Banorte’s 70%) 7.0 8.8 25% Efficiency 43.5% 41.3% ROE 20.8% 23.7% ROA 1.8% 1.8%
Banorte USA Developments • Commissions and fees: +11%. • International services, remittances and letters of credit. • Banorte Securities. • Operating Income: +32%; Net Income: +70%. • Branch referrals. • US $40 million. • 2,672 accounts. • Cross border mortgages. • Origination: US $39 million in 1H07; US $80 million expected in ’07.
Stock Performance 2004 - 2007 Banorte: 478 Bolsa: 334
Market Capitalization MILLION DOLLARS 9,209 8,478 4,660 3,365 1,792 CAGR 60% 1,420 2Q03 2Q04 2Q05 2Q06 2Q07 Aug-07
Daily Turnover MILLION DOLLARS 20.2 14.9 7.2 CAGR 78% 5.4 2.0 1H03 1H04 1H05 1H06 1H07
Profitability. Average NIM of 7.5% during the year. Consensus Net Income for ’07e: Ps $6.7 – $6.8 billion. Branch Expansion Program. Total: 70 in 2007. 52 new branches in ’07 (29 originally planned) and 50 in ‘08. 18 refurbishments and relocations in ’07 and 18 in ‘08. Planned investment of US $30 million remains unaltered. Asset Quality. Seasoning of the credit card portfolio. Provisions: 1.5% of the average loan portfolio during the year. Final Considerations