Download
1 / 33
340 likes | 679 Vues
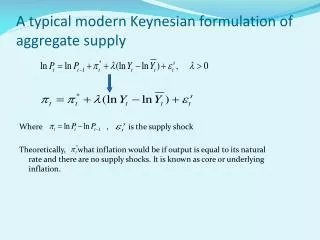
A typical modern Keynesian formulation of aggregate supply. Where , is the supply shock Theoretically, what inflation would be if output is equal to its natural rate and there are no supply shocks. It is known as core or underlying inflation.

E N D
A typical modern Keynesian formulation of aggregate supply Where , is the supply shock Theoretically, what inflation would be if output is equal to its natural rate and there are no supply shocks. It is known as core or underlying inflation.
Keynesian formulation of aggregate supply (Cont.) • In a simple model, Lesson: There is a tradeoff between output and the change in inflation, but no permanent tradeoff between output and inflation.
Let’s replace the output by the unemployment rate The welfare function 政策启示: 除非政策制定者愿意接受无限上升或下降的通胀,否则政策不能影响失业率 通胀率的平均变化是由平均的失业率变化和平均的供给面冲击 由于通胀率与失业率是线性相关,那么我们在政策制定时,可以只关注通胀率 A baseline case for inflation and unemployment
如果存在时间价值 政策启示: 永久性通胀率的上升的福利成本应该与一次性的失业率下降的福利收益相等 A baseline case for inflation and unemployment (Cont.) 稳定性政策(Stabilization policy)的有效性:由于一阶求导跟 和 无关,所以我们最优的通胀率就是符合上述公式,是一个静态的最优过程。 如果政策制定者为了高通胀率采取较为平和的降低通胀率的措施,而使经济陷于一个长期的低迷状态。还不如使通胀率一步到位满足上述公式,其成本可能更小。
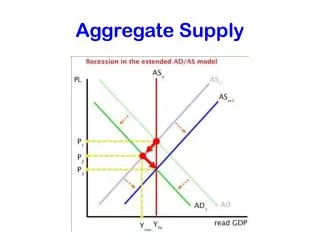
$ 0 Three Facts About Economic Fluctuations FACT 1: Economic fluctuations are irregular and unpredictable. U.S. real GDP, billions of 2000 dollars The shaded bars are recessions
$ 0 Three Facts About Economic Fluctuations FACT 2: Most macroeconomic quantities fluctuate together. Investment spending, billions of 2000 dollars
0 Three Facts About Economic Fluctuations FACT 3: As output falls, unemployment rises. Unemployment rate, percent of labor force
Lucas (1987) 一个representative agent CRRA 消费增长是一个trend stationary 无波动的消费效用 在取 =5,和 =0.015的情况下,美国的 只有0.06% 美国的稳定性政策
稳定性政策是否无关紧要? • Lucas的模型首先是建立在一个Representative agent上的,可是是否存在这样一个representative agent? • Atkeson 和Phelan(1994)的模型:在存在消费者差异的情况下,稳定性政策也毫无作用。 • 失业率 • 社会福利与失业率的变动无关,只与均值相关,所以稳定失业率不会影响人们的消费福利
稳定性政策是否无关紧要? • 消费波动成本便非唯一的波动成本,如:工作时间的波动成本。 • Ball 和 D.Romer(1990)指出: • 人们在经济低迷时,减少的工作时间,即增加的空闲时间的效用并不能抵消人们减少的消费效用; • 在经济景气的时,人们减少的空闲时间的效用却可以抵消增加的消费效用 • 人们对消费的厌恶可能比Lucas的模型的厌恶系数要高 • 稳定政策的间接效用:即稳定的经济有助于增加投资,从而保障长期的经济发展 • 失业率和通胀的线性关系目前并不确定,如果存在非线性关系,许多解释将被推翻
中国的经济福利分析 • Ho, Ho & Li(2010), 工作论文 • 目的:分析在从计划经济向市场经济转型的过程中,中国各省的福利变动 • 数据:1952-2006, 24个省年人均消费量 • 模型:Lucas(1987)
中国的经济福利分析 • 来自增长的福利 • 福利的变化(来自增长+来自稳定)
-East: 10 Provinces -Center: 5 Provinces -West: 9 Provinces
Average Yearly Consumption Growth Rate and Volatility in Chinese Provinces: Pre-Reform (1952-1979) Center East West
Average Yearly Consumption Growth Rate and Volatility in Chinese Provinces: Post-Reform (1979-2006)
Figure 3: The ratio of relative welfare gain from consumption stabilization to a 1% extra consumption growth (Unit %)
结论 • 中国由消除消费波动所带来的福利增长比美国要大很多,接近于非洲国家的水平 • 消除消费波动在中国所带来的福利增长空间巨大 • 政策启示:在西部,要仍然推进经济不断地提升;在东部,稳定的消费政策促使人们福利提升的空间很大
中国的消费波动和福利 • Consumption fluctuation and welfare: Evidence from China, forthcoming, World Development (Chun-Yu Ho, Wai-Yip Alex Ho, Dan Li,2010) • 目的:研究各省间的消费风险分担以及跨时期消费平滑程度的变动 • 意义: • 从福利的角度衡量改革的成果 • 把有关消费风险分散的分析,以及其所引起的福利变动放在同一框架中进行研究 • 其实证结果衡量一个国家的市场摩擦程度,为政策的制定提供依据 • 实际的应用价值
模型 • Asdrubali and Kim (2008) • Each province j sells a fraction λ of its income stream Yj in exchange for a claim to the pooled income streams of all J provinces • λ : the degree of risk sharing achieved by the province. • Where
模型 (Cont.) • Consumption can be perfectly smoothed intertemporally, the province consumes its permanent income derived from ; • otherwise, the province consumes its current income • γ: be the parameter that represents the fraction of that can be saved • The change in level of consumption for province j is • where is the province-specific factor for consumption growth and is the change (or innovation) in permanent income from t-1 to t.
模型 (Cont.) • By averaging consumption growth of all provinces, the aggregate average consumption growth: • Where and • The change in provincial consumption becomes • where the intercept , the error
Consumption risk sharing & smoothing Model (Asdrubali & Kim, 2008): is the province-specific factor for consumption growth :consumption per capita for province j at time t, aggregate consumption per capita. :GDP per capita for province j at time t, the permanent income for province j at time t Fraction of risk sharing, λ Fraction of no risk sharing but smoothing, γ the innovations in permanent income from time t-1 to t IV estimation
Evaluating welfare gain • CRRA utility function: • Welfare Measures (van Wincoop, 1994) • Consumption follows unit root • Calibration: Crucini & Hess (2000) • β = 0.99; δ = 2,5 • Risk-adjusted growth rate, = 0.017 • Interest rate, r = 0.078
Data China Data Center, University of Michigan-Ann Arbor Sample Annual data, 1953-2006 24 provinces (out of 31) Variables Y = GDP C = Household consumption Population Retail Price Index at year 2000 Government transfer = G.Expense – G.Revenue
Descriptive statistics Standard deviation of per capita consumption growth for each province Compute average growth rate and its standard error Consumption volatility decreases Income volatility decreases OECD data from Boyreau-Debray and Wei (2005)
Descriptive statistics Define dlnCi: Per capita consumption growth of a province dlnC-i: Per capita consumption growth of rest of the country Consumption correlation increases Income correlation decreases OECD data from Boyreau-Debray and Wei (2005)
Consumption risk sharing & smoothing • Imperfect risk sharing and smoothing • Risk sharing ↓, but smoothing ↑ after the reform • Compared to OECD and EU countries, worse risk sharing but better smoothing • Compared to US states, worse in both
Welfare Implication • Willing to pay about 11% of consumption to eliminate fluctuations in post reform era • Willing to pay decrease from the pre-reform to post-reform period • As the reform continues, people value more for the risk sharing
Contributions An integrated model Consumption risk sharing in China Extend Boyreau-Debray and Wei (2005) and Xu(2008) Using Asdrubali & Kim (2007) to disentangle the effects of risk sharing and smoothing Better than international risk sharing Worse than regional risk sharing in the US (Crucini, 1999) Gain from regional-specific eliminating consumption fluctuations Regional risk sharing > Smoothing Government enhances consumption risk