Rules for Means and Variances
120 likes | 819 Vues
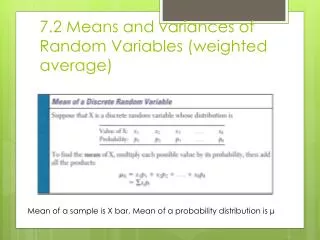
Rules for Means and Variances. Presentation 6.4 Overview. Rules for Means. On the math portion of the SAT, the mean score was 510 with a standard deviation of 95. On the verbal portion, the mean score was 530 with a standard deviation of 85. What was the combined mean?

Rules for Means and Variances
E N D
Presentation Transcript
Rules for Means and Variances Presentation 6.4 Overview
Rules for Means • On the math portion of the SAT, the mean score was 510 with a standard deviation of 95. On the verbal portion, the mean score was 530 with a standard deviation of 85. What was the combined mean? • Finding a combined mean is relatively simple. • If X and Y are two different random variables (such as math score and verbal score), then: • That is, simply add the two means. • Then the mean combined score is 510 + 530 = 1040
Rules for Variances • On the math portion of the SAT, the mean score was 510 with a standard deviation of 95. On the verbal portion, the mean score was 530 with a standard deviation of 85. What was the combined standard deviation? • Finding a combined standard deviation is more complex. • If X and Y are two different random variables (such as math score and verbal score), then: • That is, you CANNOT add the standard deviations, but you CAN ADD THE VARIANCES! • Then the standard deviation of the combined score is:
Working with Combined Variables • On the math portion of the SAT, the mean score was 510 with a standard deviation of 95. On the verbal portion, the mean score was 530 with a standard deviation of 85. • We now know the mean of the combined score is 1040 with a standard deviation of 127.48. • Given that these are normal distributions, we can do normal calculations with the combined statistics. • What is the probability that a random student scored 1100 or better? • Normalcdf (1100,9999,1040,127.48) = .3189 • What score would you need to be in the top 5%? • Invnorm (.95,1040,127.48) = 1249.7
More Rules for Means and Variances • Consider measuring the height of everyone in the class. We obtain a mean of 67 inches and a standard deviation of 3 inches. • What if, due to a misplaced measuring stick, we accidentally measured everyone to be 1 inch shorter than they actually were? • What would the new mean be? • That is, the mean was just an inch smaller than it should have been, so simply add the inch to the mean. • Then the new mean is 67 + 1 = 68 inches.
More Rules for Means and Variances • Consider measuring the height of everyone in the class. We obtain a mean of 67 inches and a standard deviation of 3 inches. • What if we needed to the measurements in centimeters instead of inches (there are 2.54 cm in one inch)? • What would the new mean be? • That is, we can simply convert the mean to cm by multiplying by 2.54. • Then the new mean is 67 (2.54) = 170.18 cm.
More Rules for Means and Variances • Consider measuring the height of everyone in the class. We obtain a mean of 67 inches and a standard deviation of 3 inches. • With means you can combine the two previous ideas to arrive at a general rule. • The moral of the story of means, which seems to be common sense, is: • You can add them to one another. • You can add a constant to them. • You can multiply them by a constant.
More Rules for Means and Variances • Consider measuring the height of everyone in the class. We obtain a mean of 67 inches and a standard deviation of 3 inches. • What if, due to a misplaced measuring stick, we accidentally measured everyone to be 1 inch shorter than they actually were? • What would the new standard deviation be? • Recall that standard deviation is a measure of spread. How much would the spread change if we just added one to each number in the dataset? • That is, the spread, and thus standard deviation (and variance) is exactly the same. • Then the new standard deviation is still 3 inches.
More Rules for Means and Variances • Consider measuring the height of everyone in the class. We obtain a mean of 67 inches and a standard deviation of 3 inches. • What if we needed to the measurements in centimeters instead of inches (there are 2.54 cm in one inch)? • What would the new standard deviation be? • Certainly the data’s spread will increase if we multiply each number in the dataset by 2.54. • That is, don’t work with the standard deviation, use the variances. Then, you have to similarly square the constant (2.54) you’re working with as well. • Then the new standard deviation is 7.62.
More Rules for Means and Variances • Consider measuring the height of everyone in the class. We obtain a mean of 67 inches and a standard deviation of 3 inches. • With standard deviaitons (and variances) you can combine the two previous ideas to arrive at a general rule. • The moral of the story of standard deviations is to work with the variances instead: • You can add the variances but you cannot add the standard deviaitons. • Add a constant to the variable does not affect the standard deviation or variance. • You can multiply the variance by the square of the constant.
Mean and Variance of a Random Variable • This concludes this presentation.