Download
1 / 16
160 likes | 372 Vues
Testing the Equality of Means and Variances in Over-Time Data. David A. Kenny. Goal. Testing the null hypothesis that the mean or the variance does not change over time. (All of the tests can be done with as few as two time points.). Example Data.

E N D
Testing the Equality of Means and Variances in Over-Time Data David A. Kenny
Goal Testing the null hypothesis that the mean or the variance does not change over time. (All of the tests can be done with as few as two time points.)
Example Data Dumenci, L., & Windle, M. (1996). Multivariate Behavioral Research, 31, 313-330. Depression with four indicators (CESD) PA: Positive Affect (lack thereof)DA: Depressive Affect (used for univariate analyses) SO: Somatic Symptoms IN: Interpersonal Issues Four times separated by 6 months 433 adolescent females Age 16.2 at wave 1
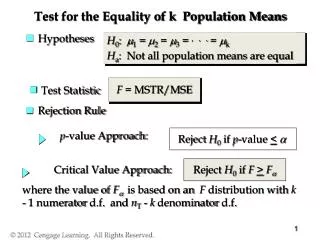
Equal Means: Univariate • Same variable measured at T times • Correlate the T variables. • Fix means to be equal (m1 = m2 = m3 = m4) and test with df of T – 1. • Alternatively, run a multivariate repeated measures analysis of variance and test the main effect of time.
Means Example: Univariate • Four means: 6.01, 5.70, 5.21, 4.71 • c2(3) = 25.56, p < .001; RMSEA = 0.132; TLI = .908 • Conclusion: Means differ.
Means of a Latent Variable • k indicators of a construct measured at T times • Correlate the T latent variables. • Loadings of the same indicator set equal. • Correlate the errors of the same indicator measured at different times. • Fix the intercept of the marker variables to zero. • Free the other intercepts but set them equal over time; a total of (k – 1)(T – 1) constraints • Free factor means and see if the model fits.
Equality of the Means of a Latent Variable • Assuming good fit of a model with latent means, fix the factor means (m1 = m2 = m3 = m4) to be equal to test the equality of factor means; T – 1 df.
Example Means: Latent Variable, Base Model • Model with No Constraints on the Means • c2(83) = 123.66, p = .003 • RMSEA = 0.034; TLI = .985 • Model with Latent Means and Constraints on the Intercepts • c2(92) = 157.49, p = .003 • RMSEA = 0.041; TLI = .979 • Fit is worse with the constraints, but the model fit (RMSEA and TLI) are acceptable. • Can test if means differ.
Example Means: Latent Variable • The four means: 25.34, 25.82, 21.72, 20.09 • Base Model • c2(92) = 157.49, p = .003 • RMSEA = 0.041; TLI = .979 • Equal Latent Means • c2(95) = 182.94, p < .001 • RMSEA = 0.046; TLI = .973 • Test of the null hypothesis of equal variance: • c2(3) = 25.44, p < .001 • Conclusion: Means differ.
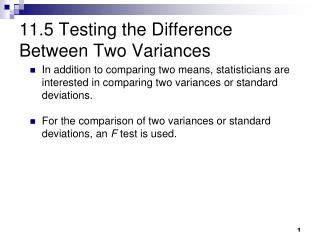
Equal Variance: Univariate • Correlate the T variables. • Fix the T the variances (s1 to s4) to be equal and test with df of T – 1.
Example: Univariate • Four variances: 27.91, 27.27, 23.74, 22.16 • c2(3) = 9.55, p = .023; RMSEA = 0.071;TLI = .973 • Conclusion: Variance are statistically different, but the model fits are acceptable, and for parsimony they could be kept equal.
Equal Variance: Latent Variable • Fix the T factor variances to be equal (s1 = s2 = s3 = s4). • Compare this model to a model in which factor variances are free to vary with T – 1 df.
Example: Latent Variable • The four latent variances: 25.34, 25.82, 21.72, 20.09 • Base Model • c2(83) = 123.66, p = .003 • RMSEA = 0.034; TLI = .985 • Equal Variances • c2(86) = 133.43, p = .001 • RMSEA = 0.036; TLI = .984 • Test of the null hypothesis of equal variance: • c2(3) = 9.76, p = .021 • Variances significantly different, but model fit is not all that different from the base model.