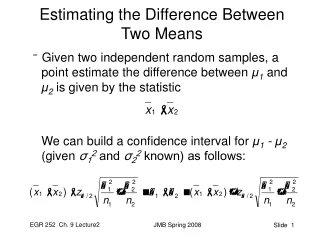
11.5 Testing the Difference Between Two Variances
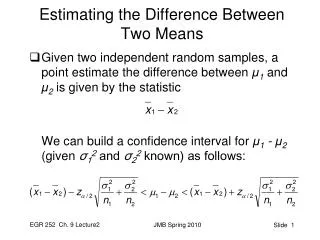
11.5 Testing the Difference Between Two Variances. In addition to comparing two means, statisticians are interested in comparing two variances or standard deviations. For the comparison of two variances or standard deviations, an F test is used. Testing the Difference Between Two Variances.

11.5 Testing the Difference Between Two Variances
E N D
Presentation Transcript
11.5 Testing the Difference Between Two Variances • In addition to comparing two means, statisticians are interested in comparing two variances or standard deviations. • For the comparison of two variances or standard deviations, an F test is used.
Testing the Difference Between Two Variances where the larger of the two variances is placed in the numerator regardless of the subscripts. The F test has two terms for the degrees of freedom: that of the numerator, n1 – 1, and that of the denominator, n2 – 1, where n1 is the sample size from which the larger variance was obtained.
F-Table Find the critical value for a right-tailed F test when α = 0.05, the degrees of freedom for the numerator (abbreviated d.f.N.) are 15, and the degrees of freedom for the denominator (d.f.D.) are 21. Since this test is right-tailed with a 0.05, use the 0.05 table. The d.f.N. is listed across the top, and the d.f.D. is listed in the left column. The critical value is found where the row and column intersect in the table.
F-table Find the critical value for a right-tailed F test when α = 0.05, the degrees of freedom for the numerator (abbreviated d.f.N.) are 15, and the degrees of freedom for the denominator (d.f.D.) are 21. F = 2.18
F-Table Find the critical value for a two-tailed F test with α = 0.05 when the sample size from which the variance for the numerator was obtained was 21 and the sample size from which the variance for the denominator was obtained was 12. When you are conducting a two-tailed test, α is split; and only the right tail is used. The reason is that F 1. Since this is a two-tailed test with α = 0.05, the 0.05/2 = 0.025 table must be used. Here, d.f.N. = 21 – 1 = 20, and d.f.D. = 12 – 1 = 11.
F-table Find the critical value for a two-tailed F test with α = 0.05 when the sample size from which the variance for the numerator was obtained was 21 and the sample size from which the variance for the denominator was obtained was 12. F = 3.23
Notes for the Use of the F Test • The larger variance should always be placed in the numerator of the formula regardless of the subscripts. • For a two-tailed test, the α value must be divided by 2 and the critical value placed on the right side of the F curve. • If the standard deviations instead of the variances are given in the problem, they must be squared for the formula for the F test. • When the degrees of freedom cannot be found in F-table, the closest value on the smaller side should be used.
Assumptions for Using the F Test • The populations from which the samples were obtained must be normally distributed. (Note: The test should not be used when the distributions depart from normality.) • The samples must be independent of each other.
Heart Rates of Smokers A medical researcher wishes to see whether the variance of the heart rates (in beats per minute) of smokers is different from the variance of heart rates of people who do not smoke. Two samples are selected, and the data are as shown. Using α = 0.05, is there enough evidence to support the claim? Step 1: State the hypotheses and identify the claim.
Heart Rates of Smokers Step 2: Find the critical value. Use the 0.025 table in Table H since α = 0.05 and this is a two-tailed test. Here, d.f.N. = 25, and d.f.D. = 17. The critical value is 2.56 (d.f.N. 24 was used). Step 3: Compute the test value.
Heart Rates of Smokers Step 4: Make the decision. Reject the null hypothesis, since 3.6 > 2.56. Step 5: Summarize the results. There is enough evidence to support the claim that the variance of the heart rates of smokers and nonsmokers is different.
Doctor Waiting Times The standard deviation of the average waiting time to see a doctor for non-lifethreatening problems in the emergency room at an urban hospital is 32 minutes. At a second hospital, the standard deviation is 28 minutes. If a sample of 16 patients was used in the first case and 18 in the second case, is there enough evidence to conclude that the standard deviation of the waiting times in the first hospital is greater than the standard deviation of the waiting times in the second hospital? Step 1: State the hypotheses and identify the claim.
Doctor Waiting Times The standard deviation of the average waiting time to see a doctor for non-lifethreatening problems in the emergency room at an urban hospital is 32 minutes. At a second hospital, the standard deviation is 28 minutes. If a sample of 16 patients was used in the first case and 18 in the second case, is there enough evidence to conclude that the standard deviation of the waiting times in the first hospital is greater than the standard deviation of the waiting times in the second hospital? Step 2: Find the critical value. Here, d.f.N. = 15, d.f.D. = 17, and α = 0.01. The critical value is F = 3.31.
Doctor Waiting Times Step 3: Compute the test value. Step 4: Make the decision. Do not reject the null hypothesis since 1.31 < 3.31. Step 5: Summarize the results. There is not enough evidence to support the claim that the standard deviation of the waiting times of the first hospital is greater than the standard deviation of the waiting times of the second hospital.