Download
1 / 13
130 likes | 420 Vues
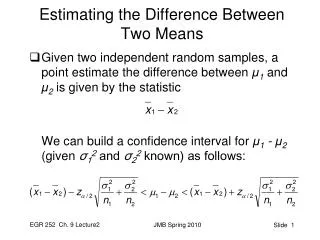
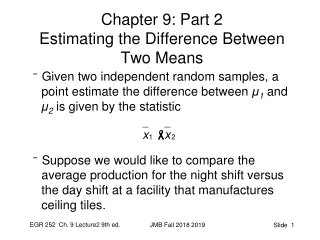
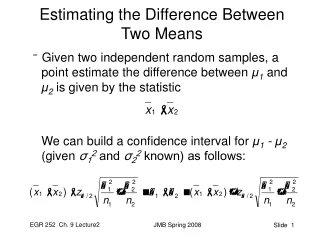
Estimating the Difference Between Two Means. Given two independent random samples, a point estimate the difference between μ 1 and μ 2 is given by the statistic We can build a confidence interval for μ 1 - μ 2 (given σ 1 2 and σ 2 2 known) as follows:. Example 9.9 Page 289.

E N D
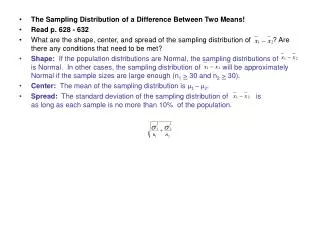
Estimating the Difference Between Two Means • Given two independent random samples, a point estimate the difference between μ1 and μ2 is given by the statistic We can build a confidence interval for μ1 - μ2 (given σ12 and σ22 known) as follows: JMB Spring 2008
Example 9.9 Page 289 • Find a 96% Confidence Interval • xbarA = 36 mpg σA = 6 nA = 50 • xbarB = 42 mpg σB = 8 nB = 75 • α=0.04 α/2 =0.02 Z0.02 = 2.055 Calculations: 6 – 2.055 sqrt(64/75 + 36/50) < μB - μA < 6 + 2.055 sqrt(64/75 + 36/50) Results: 3.4224 < μB - μA < 8.5776 96% CI is (3.4224, 8.5776) JMB Spring 2008
Differences Between Two Means: Variances Unknown • Case 1: σ12 and σ22 unknown but “equal” • Page 291 Where, • Note v = n1 + n2 -2 JMB Spring 2008
Differences Between Two Means: Variances Unknown (Page 293) • Case 2: σ12 and σ22 unknown and not equal Where, • WOW! JMB Spring 2008
Estimating μ1 – μ2 • Example (σ12 and σ22 known) : A farm equipment manufacturer wants to compare the average daily downtime of two sheet-metal stamping machines located in two different factories. Investigation of company records for 100 randomly selected days on each of the two machines gave the following results: x1 = 12 minutes x2 = 10 minutes s12 = 12 s22 = 8 n1 = n2 = 100 • Construct a 95% C.I. for μ1 – μ2 JMB Spring 2008
Solution • 95% CI Z.025 = 1.96 • (12-10) + 1.96*sqrt(12/100 + 8/100) = 2 + 0.8765 • 1.1235 < μ1 – μ2 < 2.8765 • Interpretation: If CI contains 0, then μ1 – μ2 may be either positive or negative (can’t say that one is larger than the other); however, since the CI for μ1 – μ2is positive, we conclude μ1 must be larger than μ2 . JMB Spring 2008
μ1 – μ2 : σi2 Unknown • Example (σ12 and σ22 unknown but “equal”): Suppose the farm equipment manufacturer was unable to gather data for 100 days. Using the data they were able to gather, they would still like to compare the downtime for the two machines. The data they gathered is as follows: x1 = 12 minutes x2 = 10 minutes s12 = 12 s22 = 8 n1 = 18 n2 = 14 Construct a 95% C.I. for μ1 – μ2 JMB Spring 2008
Solution Governing Equations: Calculations: t0.025,30= 2.042 sp2 = ((17*12)+(13*8))/30 = 10.267 sp = 3.204 2 + 2.042*3.204*sqrt(1/18 + 1/14) = 2 + 2.3314 -0.3314 < μ1 – μ2 < 4.3314 Interpretation: Since this CI contains 0, we can’t conclude μ1 > μ2 . JMB Spring 2008
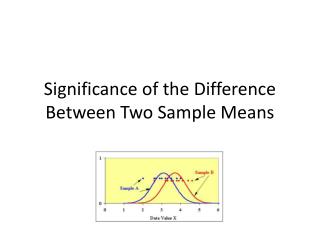
Paired Observations • Suppose we are evaluating observations that are not independent … For example, suppose a teacher wants to compare results of a pretest and posttest administered to the same group of students. • Paired-observation or Paired-sample test … Example: murder rates in two consecutive years for several US cities. Construct a 90% confidence interval around the difference in consecutive years. JMB Spring 2008
Calculation of CI for Paired Data Example 9.12 We have 20 pairs of values. We calculate the difference for each pair. We calculate the sample standard deviation for the difference values. The appropriate equations are: μd = μ1 – μ2 Based on the data in Table 9.1 Dbar = -0.87 Sd = 2.9773 n=20 We determine that a (1-0.05)100% CI for μd is: -2.2634 < μd < 0.5234 Interpretation: If CI contains 0, then μ1 – μ2 may be either positive or negative (can’t say that one is larger than the other). Since this CI contains 0, we conclude there is no significant difference between the mean TCDD levels in the fat tissue. JMB Spring 2008
C.I. for Proportions • The proportion, P, in a binomial experiment may be estimated by where X is the number of successes in n trials. • For a sample, the point estimate of the parameter is • The mean for the sample proportion is and the sample variance JMB Spring 2008
C.I. for Proportions • An approximate (1-α)100% confidence interval for p is: • Large-sample C.I. for p1 – p2is: • Interpretation: If the CI contains 0 … JMB Spring 2008
Example 9.16 Page 304 • If the C.I. for p1 – p2 = (-0.0017, 0.0217), is there reason to believe there is a significant decrease in the proportion defectives using the new process? • What if the interval were (+0.002, +0.022)? • What if the interval were (-0.900, -0.700)? JMB Spring 2008