SPARC SOLARIS & HEPPA Intercomparison Activities:
20 likes | 176 Vues
2004: “solar max” (declining phase of SC23). SORCE Irradiance Data (Harder et al., 2009) NRLSSI Irradiance Data (Lean et al., 2005). 2007: “solar min” (close to minimum of SC23). SPARC SOLARIS & HEPPA Intercomparison Activities:

SPARC SOLARIS & HEPPA Intercomparison Activities:
E N D
Presentation Transcript
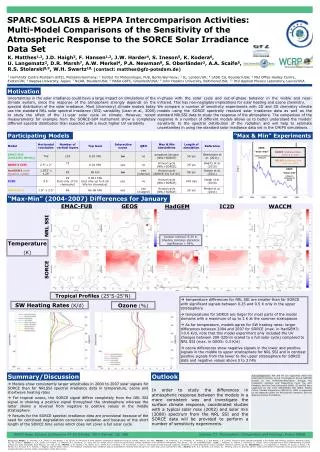
2004: “solar max” (declining phase of SC23) SORCE Irradiance Data (Harder et al., 2009) NRLSSI Irradiance Data (Lean et al., 2005) 2007: “solar min” (close to minimum of SC23) SPARC SOLARIS & HEPPA Intercomparison Activities: Multi-Model Comparisons of the Sensitivity of the Atmospheric Response to the SORCE Solar Irradiance Data Set K. Matthes1,2, J.D. Haigh3, F. Hansen1,2, J.W. Harder4, S. Ineson5, K. Kodera6, U. Langematz2, D.R. Marsh7, A.W. Merkel4, P.A. Newman8, S. Oberländer2, A.A. Scaife5, R.S. Stolarski8,9, W.H. Swartz10, (contact: matthes@gfz-potsdam.de) 1Helmholtz Centre Postdam (GFZ), Potsdam/Germany; 2 Institut für Meteorologie, FUB, Berlin/Germany; 3 IC, London/UK; 4 LASP, CU, Boulder/USA; 5 Met Office Hadley Centre, Exeter/UK; 6 Nagoya University, Japan; 7 NCAR, Boulder/USA; 8 NASA GSFC, Greenbelt/USA; 9 John Hopkins University, Baltimore/USA; 10 JHU Applied Physics Laboratory, Laurel/USA Motivation Uncertainties in the solar irradiance could have a large impact on simulations of the climate system, since the response of the atmosphere strongly depends on the spectral distribution of the solar irradiance. Most (chemistry) climate models today use the standard NRL solar spectral irradiance (SSI) variability (Lean et al., 2005) to study the effect of the 11-year solar cycle on climate. However, recent measurements for example from the SORCE-SIM instrument show a completely different spectral distribution than expected with a much higher UV variability in-phase with the solar cycle and out-of-phase behavior in the visible and near-infrared. This has non-negligible implications for solar heating and ozone chemistry. We compare a number of sensitivity experiments with 2D and 3D chemistry climate models using the SORCE spectrally resolved solar irradiance data as well as the standard NRLSSI data to study the response of the atmosphere. The comparison of the response in a number of different models allows us to better understand the models’ sensitivity to the spectral distribution of the radiation and will help to estimate uncertainties in using the standard solar irradiance data set in the CMIP5 simulations. Participating Models “Max & Min” Experiments “Max-Min” (2004-2007) Differences for January EMAC-FUB GEOS HadGEM IC2D WACCM NRL SSI Contour interval: 0.25 K. Shading indicates statistical significance > 95%. Temperature (K) SORCE Tropical Profiles (25°S-25°N) temperature differences for NRL SSI are smaller than for SORCE with significant signals between 0.25 and 0.5 K only in the upper stratosphere • temperatures for SORCE are larger for most parts of the model domains with a maximum of up to 2 K at the summer stratopause • As for temperature, models agree for SW heating rates: larger differences between 2004 and 2007 for SORCE (max. in HadGEM3: >0.6 K/d, note that this model experiment only included the UV changes between 200-320nm scaled to a full solar cycle) compared to NRL SSI (max. in GEOS: 0.3 K/d) • ozone differences show negative signals in the lower and positive signals in the middle to upper stratosphere for NRL SSI and in contrast positive signals from the lower to the upper stratosphere for SORCE data and negative values above 5 to 2 hPa SW Heating Rates(K/d) Ozone (%) Outlook Summary/Discussion Acknowledgments:KM and FH are supported within the Helmholtz-University Young Investigators Group NATHAN funded by the Helmholtz-Association through the President’s Initiative and Networking Fund, the GFZ Potsdam, and the Freie Universität Berlin. SI and AS were supported by the Joint DECC/Defra Met Office Hadley Centre Climate Programme (GA01101). DRM is supported by the National Center for Atmospheric Research and the National Science Foundation. • Models show consistently larger amplitudes in 2004 to 2007 solar signals for SORCE than for NRLSSI spectral irradiance data in temperature, ozone and shortwave heating rates For tropical ozone, the SORCE signal differs completely from the NRL SSI signal in showing a positive signal throughout the stratosphere whereas the latter shows a reversal from negative to positive values in the middle stratosphere Results for the SORCE spectral irradiance data are provisional because of the need for continued degradation correction validation and because of the short length of the SORCE time series which does not cover a full solar cycle In order to study the differences in atmospheric response between the models in a more consistent way and investigate the surface climate response, coordinated studies with a typical solar max (2002) and solar min (2008) spectrum from the NRL SSI and the SORCE data will be provided to perform a number of sensitivity experiments. WCRP Open Science Conference 24-28 October 2011 Denver, CO, USA Session C7: Atmospheric Composition and Forcings, Poster M06B References:Haigh,J. D., Winning, A. R., Toumi, R. and Harder, J. W. (2010): An influence of solar spectral variations on radiative forcing on climate, Nature, Vol. 467.; Harder, J. W., Fontenla, J. M., Pilewskie, P. , Richard, E. C. and Woods, T. N.(2009): Trends in Solar Spectral Variability in the Visible and Infrared, Geophys. Research Letter, Vol. 36, L07801.; Ineson, S., A.A. Scaife, J.R. Knight, J.C. Manners, N.J. Dunstone, L.J. Gray, and J.D. Haigh (2011): Solar forcing of winter climate variability in the Northern Hemisphere, Nat. Geosci., doi: 10.1038/NGEO1282.; Lean, J., Rottman, G., Harder, J. and Kopp, G. (2005): Sorce Contributions to New Understanding of Global Change and Solar Variability, Solar Physics, Vol. 230, 27-53.; Merkel, A. W., Harder, J. W., Marsh, D. R., Smith, A. K., Fontenla, J. M. and Woods, T. (2011): The impact of solar spectral irradiance variability on midlle atmosphere ozone, Geophys. Research Letters, Vol 38.; Oberländer, S., U. Langematz, K. Matthes, M. Kunze, A. Kubin, J.W. Harder, N.A. Krivova, S. K. Solanki, J. Pagaran, and M. Weber (2011): The influence of spectral solar irradiance data on stratospheric heating rates during the 11 year solar cycle, submitted to GRL.; Swartz, W.H., R.S. Stolarski, L.D. Oman, E.L. Fleming, and C.H. Jackman (2010): Solar cycle effects of spectrally varying solar irradiance in a coupled chemistry–climate model, presentation at the AGU in Dec.
2004: “solar max” (declining phase of SC23) SORCE/SIM Irradiance Data (Harder et al., 2009) NRLSSI Irradiance Data (Lean et al., 2005) 2007: “solar min” (close to minimum of SC23) 2004 end of solar maximum „Lean smax“ „SORCE smax“ 1) Lean Irradiance Data 2) SIM/SORCE Irradiance Data „Lean smin“ „SORCE smin“ 2007 beginning of solar minimum