Download

1 / 19
190 likes | 419 Vues
Ozcan: Chapter 9 Productivity Lecture 2. ISE 468 ETM 568 Dr. Joan Burtner. Outline. Productivity Improvement Trends in Healthcare Productivity: Consequences of Medicare Prospective Payment System (PPS) Productivity Definitions and Measurements Productivity Benchmarking

E N D
Ozcan: Chapter 9 Productivity Lecture 2 ISE 468 ETM 568 Dr. Joan Burtner
Outline • Productivity Improvement • Trends in Healthcare Productivity: Consequences of Medicare Prospective Payment System (PPS) • Productivity Definitions and Measurements • Productivity Benchmarking • Multifactor Productivity • Commonly Used Productivity Ratios: Hours per Patient Day or Visit • Adjustment for Inputs • Skill-Mix Adjustment to Worked Hours • Cost of Labor • Adjustments for Output Measures :Service/Case-Mix Adjustments • Productivity Measures Using Direct Care Hours • Productivity – Quality Relationship • Productivity Dilemmas • Multiple Dimensions of Productivity:Data Envelopment Analysis(DEA) Ozcan Chapter 9 Productivity Lecture 2
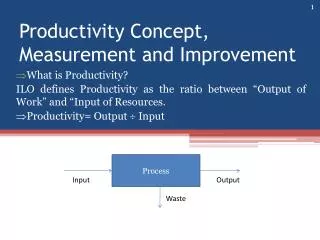
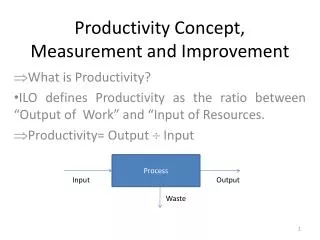
Productivity Definitions and Measurements • Productivity is one measure of the effective use of resources within an organization, industry, or nation. • The classical productivity definition measures outputs relative to the inputs needed to produce them. That is, productivity is defined as the number of output units per unit of input. Ozcan Chapter 9 Productivity Lecture 2
Sometimes, an inverse calculation is used that measures inputs per unit of output. Care must be taken to interpret this inverse calculation appropriately; the greater the number of units of input per unit of output, the lower the productivity. For example, traditionally productivity in hospital nursing units has been measured by hours per patient day (HPPD). That requires an inversion of the typical calculations: meaning total hours are divided by total patient days. Productivity Definitions and Measurements Ozcan Chapter 9 Productivity Lecture 2
Example 9.1 Nurses in Unit A worked collectively a total of 25 hours to treat a patient who stayed 5 days, and nurses in Unit B worked a total of 16 hours to treat a patient who stayed 4 days. Calculate which of the two similar hospital nursing units is more productive. Since the HPPD productivity ratio is expressed as input over output, lower is better. Unit B productivity is better than Unit A. Ozcan Chapter 9 Productivity Lecture 2
Multi-factor Productivity Looking only at labor productivity may not yield an accurate picture. Newer productivity measures tend to include not only labor inputs, but the other operating costs for the product or service as well. Ozcan Chapter 9 Productivity Lecture 2
Example 9.2 Statement A specialty laboratory performs lab tests for the area hospitals. During its first two years of operation the following measurements were gathered: Measurement Year 1 Year 2 Price per test ($) 50 50 Annual tests 10,000 10,700 Total labor costs($) 150,000 158,000 Material costs ($) 8,000 8,400 Overhead ($) 12,000 12,200 Determine and compare the multifactor productivity for historical benchmarking. Ozcan Chapter 9 Productivity Lecture 2
Example 9.2 Solution Since the multi-factor productivity ratio is expressed as output over input, higher is better. Year 2 productivity is better than Year 1. Ozcan Chapter 9 Productivity Lecture 2
Commonly Used Productivity Ratios inpatient outpatient Ozcan Chapter 9 Productivity Lecture 2
Example 9.3 Annual statistical data for two nursing units in Memorial Hospital are as follows: Measurements Unit A Unit B Annual Patient Days 14,000 10,000 Annual Hours Worked 210,000 180,000 Calculate and compare hours per patient day for two units of this hospital. Solution: Since the HPPD productivity ratio is expressed as input over output, lower is better. Unit A productivity is better than Unit B. Ozcan Chapter 9 Productivity Lecture 2
Example 9.4 Performsbetter Associates – a two-site group practice, requires productivity monitoring. The following initial data are provided for both sites of the practice: Measurements Suburban Downtown Annual Visits 135,000 97,000 Annual Paid Hours 115,000 112,000 Calculate and compare the hours per patient visit for the suburban and the downtown locations of this practice. Solution: hours or 51 minutes. hours or 69 minutes. Conclusion: Suburb is better than Downtown Ozcan Chapter 9 Productivity Lecture 2
Adjustments for Inputs . Skill-Mix Adjustmentweighs the hours of personnel of different skill levels by their economic valuation. One approach is to calculate weights based on the average wage or salary of each skill class. To do that, a given skill class wage/salary would be divided into the top class skill salary. Let’s assume RNs, LPNs and Nurses Aides are earning $35.00, $28.00, and $17.50 an hour, respectively. One hour of a nurse aide’s time is economically equivalent to 0.5 hours of a RN's time; and one hour of a LPN's time is equal to 0.8 hours of a RN's time. Ozcan Chapter 9 Productivity Lecture 2
Calculations: Adjustments for Inputs Adjusted Hours = 1.0*(RN hours) + 0.8*(LPN hours) + 0.5*(Aide hours) Ozcan Chapter 9 Productivity Lecture 2
Adjustments for Inputs . Similarly, in outpatient settings, if one hour of a nurse practitioner's (NP) time is economically equivalent to 0.6 hours of a specialist's (SP) time, and if one hour of a general practitioner’s (GP) time is equal to 0.85 hours of a specialist’s time, adjusted hours would be calculated as: Adjusted Hours = 1.0 (SP hours) + 0.85 (GP hours) + 0.6 (NP hours) Ozcan Chapter 9 Productivity Lecture 2
Adjustments for Inputs: Example 9.5 Example 9.5:Using data from Example 9.3, and economic equivalencies of 0.5 Aide = RN, 0.8 LPN = RN, calculate the adjusted hours per patient day for Unit A and Unit B. Unit A at Memorial Hospital employs 100% RNs. The current skill mix distribution of Unit B is 45% RNs, 30% LPNs, and 25% nursing aides (NAs). Compare unadjusted and adjusted productivity scores. Ozcan Chapter 9 Productivity Lecture 2
Adjustments for Inputs Example 9.5 Solution Standardized Cost of Labor. Solution: The first step is to calculate adjusted hours for each unit. For Unit A, since it employs 100% RNs, there is no need for adjustment. For Unit B: Adjusted Hours (Unit B) = 1.0 (180,000*.45) + 0.80 (180,000*.30) + 0.50 (180,000*.25). Adjusted Hours (Unit B) = 1.0 (81,000) + 0.80 (54,000) + 0.50 (45,000). Adjusted Hours (Unit B) = 146,700. In this way, using the economic equivalencies of the skill-mix, the number of hours is standardized as 146,700 instead of 180,000. hours. hours. Using adjusted hours, Unit A, which appeared productive according to the first measure (see example 9.3), no longer appears as productive. Ozcan Chapter 9 Productivity Lecture 2
Adjustments for Inputs . Standardized Cost of Labor. Total labor cost comprises the payments to various professionals at varying skills. To account for differences in salary structure across hospitals or group practices, cost calculations can be standardized using a standard salary per hour for each of the skill levels Labor Cost = RN wages (RN hours) + LPN wages (LPN hours) + NA wages (Aide hours). Ozcan Chapter 9 Productivity Lecture 2
Adjustments for Inputs Example 9.6: Performsbetter Associates in Example 9.4 pays $110, $85, and $45 per hour, respectively, to its SPs, GPs and NPs in both locations. Currently, the suburban location staff comprises 50% SPs, 30% GPs, and 20% NPs. The downtown location, on the other hand, comprises 30% SPs, 50% GPs, and 20% NPs. Calculate and compare the labor cost of care, and labor cost per visit for both locations. Ozcan Chapter 9 Productivity Lecture 2
Adjustments for Inputs: 9.6 Solution Based on Annual Visits and Annual Paid Hours listed in Example 9.4 First, calculate “Labor Cost of Care” for each location. Labor Cost = SP wages (SP hours) + GP wages (GP hours) + NP wages (NP hours), Labor CostSuburban = $110 (115,000*0.50) + $85 (115,000*0.30) + $45 (115,000*0.20). Labor CostSuburban = $110 (57,500) + $85 (34,500) + $45 (23,000). Labor CostSuburban = $10,292,500. Labor CostDowntown = $110 (112,000*.30) + $85 (112,000*0.50) + $45 (112,000*0.20). Labor CostDowntown = $110 (33,600) + $85 (56,000) + $45 (22,400). Labor CostDowntown = $9,464,000. Lower volume at Downtown location, Higher labor cost per visit Ozcan Chapter 9 Productivity Lecture 2