Download
1 / 94
940 likes | 957 Vues
Explore the integrative nature of biomonitoring as a cost-effective method using macroinvertebrates for monitoring water quality. Learn about modern concepts and techniques in aquatic ecology and stream ecosystem health.

E N D
Water Quality Dave McShaffrey Harla Ray Eggleston Department of Biology, Marietta College
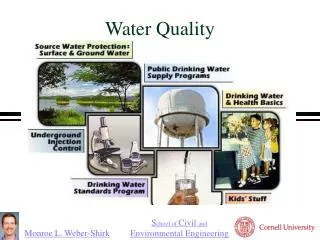
Chemical Monitoring • list of 100’s of possible parameters
Physical Monitoring • maps • remote sensing • current and flow measurements • field observations
Biomonitoring • number of organisms • indicator species • species abundance • species diversity
Summary: • physical methods only hint at water quality problems • chemical tests most discriminating, but: • expensive • need hundreds of tests • must sample at right place, right time • biomonitoring reasonable compromise • less expensive than chemical (but still expensive) • less accurate than chemical • integrative nature
Aquatic benthic macroinvertebrates ideal for biomonitoring because: • species can be associated with given water quality • remain in local area for extended periods • easy to capture, store, and identify • not as mobile as fish, which can avoid pollutants • Demonstration of WinMac using data from Tables 1&2
Ecological Basis for biomonitoring • River Continuum - now outdated • A predicatable series of changes in the biota should occur as one moves downstream • Perturbations will affect the predicted community
River Continuum Source: http://www.shorelandmanagement.org/depth/rivers/02.html
Headwater Midstream Mouth Flow: volume: lowest medium highest speed: highest? medium high channel width: smallest medium largest Temperature & Sun temperature low D T max high D T max low D T max canopy shaded open open turbidity clear slightly turbid turbid Particle size: 10mm 1mm 0.001mm Substrate diverse diverse homogeneous Seasonal effects: highest medium lowest Nutrients: P/R ratio <1 >1 <1 Food chain Heterotrophic Autotrophic Heterotrophic Nutrient Source Allochthonous Autochthonous Allochthonous Species Richness: macrobenthos high highest low phytoplankton low high low benthic algae med high low FFG's: shredders collectors filterers
Problems with the River Continuum • Poor understanding of large rivers • Underestimate stream velocities and substrates • Species richness • Not a continuum • Underestimate of headwater streams • Prediction of FFG's • Assigning FFG’s accurately • Data from New Zealand • Seasonal shifts
Modern Concepts: • nutrient spiraling • Patch dynamics • correlation of substrate diversity and species diversity • roles of biofilms • meiobenthos and interstitial organisms • interaction of stream and surrounding groundwater
Ecosystem Health and Stream Ecosystems • Diversity indices: • Number of species • SCI – sequential comparison index • Shannon-Weiner • Equitability • Biomonitoring today: • SCI • Hilsenhoff • Ohio EPA • Ohio Scenic Rivers Program
References: • Olive, J.H. and K.R. Smith. 1975. Benthic Macroinvertebrates as indices of water quality in the Scioto River Basin (Ohio). Ohio Biological Survey New Series Bulletin. 5(2). The Ohio State University Press, Columbus, Ohio. • Wihlm, J.L. and T.C. Dorris. 1968. Biological parameters for water quality criteria. Bioscience. 18(6):477-481. • Weber, C.I. (ed.) 1973. Biological field and laboratory methods for measuring the quality of surface waters and effluents. Env. Monitoring Series, Office of Research and Development, USEPA. Cinncinnati, Ohio.
Modern Techniques Current Ohio EPA Methodology Critical web pages: Overview of Water Quality Standards Interactive Map Biocriteria Page Biological Criteria Volume I – overview of why Ohio EPA uses biocriteria. Modern Techniques
Ohio Biomonitoring • In context of USEPA requirements • Sections 303(d) & 305(b) of Clean Water Act • 303(d) – states must develop lists of impaired waters • 305(b) – states must report biennielly
Section 305(b) [as codified] • (1) Each State shall prepare and submit to the Administrator by April 1, 1975, and shall bring up to date by April 1, 1976, and biennially thereafter, a report which shall include—(A) a description of the water quality of all navigable waters in such State during the preceding year, with appropriate supplemental descriptions as shall be required to take into account seasonal, tidal, and other variations, correlated with the quality of water required by the objective of this chapter (as identified by the Administrator pursuant to criteria published under section 1314(a) of this title) and the water quality described in subparagraph (B) of this paragraph; • (B) an analysis of the extent to which all navigable waters of such State provide for the protection and propagation of a balanced population of shellfish, fish, and wildlife, and allow recreational activities in and on the water; • (C) an analysis of the extent to which the elimination of the discharge of pollutants and a level of water quality which provides for the protection and propagation of a balanced population of shellfish, fish, and wildlife and allows recreational activities in and on the water, have been or will be achieved by the requirements of this chapter, together with recommendations as to additional action necessary to achieve such objectives and for what waters such additional action is necessary; • (D) an estimate of(i) the environmental impact, • (ii) the economic and social costs necessary to achieve the objective of this chapter in such State, • (iii) the economic and social benefits of such achievement, and • (iv) an estimate of the date of such achievement; and • (E) a description of the nature and extent of nonpoint sources of pollutants, and recommendations as to the programs which must be undertaken to control each category of such sources, including an estimate of the costs of implementing such programs.
Ohio EPA Metrics • 3 main metrics are calculated: • Index of Biotic Integrity (fish) - IBI • Modified Index of Well-Being - MIwb • Uses fish, 4 parameters: • Numbers of individuals • Biomass • Shannon – numbers • Shannon – weight • Invertebrate Community Index (macroinvertebrates) - ICI
Ohio EPA Metrics • Metrics used to assign waters to 1 of 7 categories for aquatic life:
1 2
4 5
6 7
Also, considerations given to human uses, chemical parameters, taste, odor, drinking water, etc. – very complicated! • We will focus on wildlife end of things, particularly ICI.
“EPA will use environmental indicators, together with measures of activity accomplishments, to evaluate the success of our programs. Working in partnership with others, we will be able to report status and trends of U.S. and global environmental quality to the public, Congress, states, the regulated community, and the international community. National program managers will use environmental indicators to determine where their programs are achieving the desired environmental results, and where inadequate results indicate strategies need to be changed. Over time, as more complete data are reported, environmental indicators will become the Agency’s primary means of reporting and evaluating success.”[Italics ours] There is a large gap, however, between this vision statement and the implementation of indicators within EPA programs and between it and the support for adequate state monitoring programs that include indicators. Nationally, tracking of the use attainment status of surface water resources has suffered from an insufficient and biased collection of ambient data. Additionally, there has been an overreliance on chemical-specific data to the exclusion of more integrative, direct measures of water resource integrity. Without the availability of direct and holistic measures of water resource integrity, tracking of the success of pollution abatement has focused on management activities (e.g., permit issuance) instead of environmental results. The failure to use more direct measures of biological integrity has led to a criticism of the effort to monitor the effects of reduced pollutants in surface waters (U.S. GAO 1986). Although the effluent loadings of many chemical parameters have been reduced since the passage of the original Clean Water Act (Smith et al. 1987) it has been difficult to relate this to improvements in aquatic life uses other than in specific instances (U.S. GAO 1986). Considering the $50 billion spent and the additional $118 billion projected for municipal WWTP construction up to the year 2000 (U. S. EPA 1982) more effort needs to be devoted toward directly quantifying the environmental results of these activities. Chemical criteria as surrogates of aquatic life use impairment have traditionally been used alone to produce estimates of the extent (e.g., miles) waterbodies are attaining or not attaining their use or to detect trends. They provide, however, little consistent information on the severity of pollution other than degree and frequency of chemical exceedences of water quality criteria. This approach …
Water Quality Standards Ohio Water Quality Standards (WQS) Ohio EPA has employed the concept of tiered aquatic life uses in the Ohio Water Quality Standards (WQS) since 1978. Aquatic life uses in Ohio include the Warmwater Habitat (WWH), Exceptional Warmwater Habitat (EWH), Cold Water Habitat (CWH), Seasonal Salmonid Habitat (SSH), Modified Warmwater Habitat (three subcategories: channel-modified, MWH-C; mine affected, MWH-A; and impounded, MWH-I), Limited Resource Water (LRW), and the now defunct Limited Warmwater Habitat (LWH) designations. Each of these use designations is defined in the Ohio WQS (OAC 3745-1).Table 2-1 lists the size of waterbodies for each aquatic life and non-aquatic life use assigned to Ohio surface waters. The lengths (miles) of designated uses by stream and river size category are illustrated in Figure 2-1.
Antidegradation Antidegradation After the initial draft of this report was complete and sent to USEPA, Ohio EPA’s new Antidegradation Rule (3745-1-05 OAC) became effective (October 1, 1996). Federal regulations require that State water quality standards must include an antidegradation policy. The antidegradation rule applies in situations where the existing water quality is better than that “necessary” to support fish and aquatic life and recreation in and on the water. Thus there is a “public trust” of high water quality that must be considered in situations where a permittee wants to add pollutants. The antidegradation rule spells out the review requirements need to approve any lowering of water quality. IN ALL CASES THE EXISTING USES MUST BE PROTECTED. Ohio EPA’s Antidegradation Rule applies to wastewater discharge (NPDES) permits and permit-to-install applications (PTIs) if there would be an increase in the permit limit for the discharge of pollutants to surface waters. With some exceptions this rule requires the Ohio EPA to do an “antidegradation” review for all new or increase discharges, Section 401 water quality certifications (“permits for the dredging and filling of streams”). Nonpoint source pollution is covered to the extent separate regulatory authority exists.