Download
1 / 18
180 likes | 207 Vues
This study presents long-term observations of Geomagnetically Induced Currents (GIC) in New Zealand, focusing on transformer current values, HVDC links, and Earth return modes. The data analysis and correction methods for GIC monitoring systems are discussed.

E N D
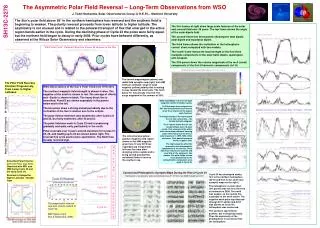
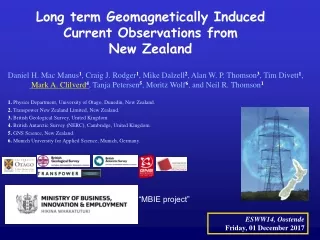
Long term Geomagnetically Induced Current Observations from New Zealand Daniel H. Mac Manus1, Craig J. Rodger1, Mike Dalzell2, Alan W. P. Thomson3,TimDivett1,Mark A. Clilverd4, Tanja Petersen5, Moritz Wolf6, and Neil R. Thomson1 1. Physics Department, University of Otago, Dunedin, New Zealand. 2. Transpower New Zealand Limited, New Zealand. 3. British Geological Survey, United Kingdom. 4. British Antarctic Survey (NERC), Cambridge, United Kingdom. 5. GNS Science, New Zealand. 6. Munich University for Applied Science, Munich, Germany. “MBIE project” ESWW14, Oostende Friday, 01 December 2017
New Zealand GIC observations Transpower New Zealand Ltd. is measuring, and archiving, observations of transformer neutral current values from DC current measuring devices (LEM) at many transformers. This has occurred from multiple South Island locations for more than 14 years. - 36 transformers monitored in 2001 - 58 transformers monitored in 2015. - in many substations more than 1 DC current measuring devices (LEM) is installed, independently monitoring each transformer 2012 and 2013 additions installed with Space Wx/GIC monitoring focus
Why so many DC observations at NZ Transformers? New Zealand has a HVDC link to link the large hydro-generation in the South Island with large population in the North Island. Often operations in a balanced or "bipolar" mode. But also common to operate in single wire Earth-return mode Haywards 100% "up" HVDC link 5-8% "stray" Earth return (multiple locations) When in Earth-return mode, ~92-95% of the current returns directly to Benmore. Benmore The other 5-8% first comes into various South Island transformers and then returns to Benmore across the AC power transmission network - we term this “stray Earth return” and it is what the LEMs exist to monitor. 92-95% "direct" Earth return
Haywards 100% HVDC link Benmore 5-8% 92-95% =LEM Need to “correct” the LEM data! Timaru 1,108 points Strong linear relationship between the Timaru transformer #5 currents (TIM T5) and the total HVDC current - outside of geomagnetic storm times (EYR K<5) and for large HVDC Earth Return currents (>100A). So can undertake weekly linear fits over all data to determine slopes, from which we can do a correction. TIM = Timaru
Haywards 100% HVDC link Benmore 5-8% 92-95% =LEM Need to correct the LEM data! Timaru Timaru transformer #5 currents (TIM T5) data after correction. Having removed the offsets and the stray currents from the LEM measurements, we should just have GIC present. TIM = Timaru
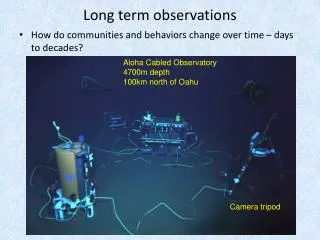
H’ Example of a large geomagnetic storm6 November 2001 Eyrewell ΔH500nT Triggered by a solar wind shock observed by SOHO at 01:20 UT
H’ =LEM = Alarms Strong spatial variations in the peak currents over small distances! Peaks at 01:52 UT ISL SVC (tripped) HWB T4 (destroyed) Example of a large geomagnetic storm6 November 2001 50 km Currents measured at ISL M6
Watari et al. [2009], correlations between B-field driver and Hokkaido GIC Large GICs are usually closely associated with geomagnetic field disturbances that have a high rate of change (dB/dt) and in particular the magnetic component in the horizontal direction (dBH/dt, also represented by H') [Mäakinen, 1993; Viljanen, 1998, Bolduc et al., 1998]. However, Watari et al. [2009] concluded that in their observations "Temporal variations of GICs show high correlation with geomagnetic field variations, rather than time derivatives of the geomagnetic field"! We test this suggestion with the NZ data. Watari, S., et al. (2009), Space Weather, 7, S03002, doi:10.1029/2008SW000417.
= GIC measuring location = Magnetometer ISLington Case Study: Correlations for 6 Nov 2001 The highest GIC in this storm seen at Islington transformer #6 (ISL M6). So start by looking at the correlations for this storm period, and this transformer. r = 0.61 ISL location is similar distance from coast as Memanbatsu “Correlation” = Pearson r correlation coefficient r = 0.71 Triggered by a solar wind shock observed by SOHO at 01:20 UT Generally, rate of change wins
= GIC measuring location = Magnetometer ISLington Case Study: Correlations for 2 Oct 2013 For consistency, look at the correlation with the GIC in this storm seen at Islington transformer #6 (ISL M6). r = -0.31 “Correlation” = Pearson r correlation coefficient Triggered by a solar wind shock observed by SOHO at 01:25 UT r =- 0.95 Again, rate of change wins (but clearer this time)
= GIC measuring location = Magnetometer ISLington General Study using Islington M6 Lets look at that at that Memanbatsu-like location again (Islington ISL M6). Try and look at the long term dataset. Build a set of hourly time periods of disturbed periods. One or more of these conditions must hold: 1. Peak one minute averaged GIC magnitude is ≥10 A at anyone of ISL M6, HWB T4 HWB T6, or SDN T2, for any time during that hour. 2. variation in the EYR H is ≥200 nT 3. The peak one minute resolution value of EYR |H'| is ≥50 nT/min. That produces 151 hourly periods for us to look into correlations at ISL M6. “Correlation” = Pearson r correlation coefficient Again, rate of change wins
St Patrick’s Day 2015 Storm – Case Study |H’| “HWB T4” storm “Halloween” storm “St Patrick’s Day” storm Triggered by a solar wind shock observed by SOHO at 04:11 UT For the St Patrick's Day storm the peak rate of change at EYR in the H-component maggie data is at 17-March-2015 4:46 UT. = New measuring locations This is a particularly good event as it is in the more modern era when a large number of new current measuring locations were included! [Cromwell starts from 2009, other start from 2012] Cromwell Clyde Manapouri Halfway Bush South Dunedin Invercargill
St Patrick’s Day 2015 Storm - Dunedin By most international standards the St. Patrick’s Day storm response at HWB T4 (47.8 A) and SDN (45.5 A) is a large GIC event at least in the Dunedin-region, even though this is not that big a geomagnetic storm or rate of change at the storm onset. Halfway Bush T4 In New Zealand GIC in the range 15-50 A have been seen for H’ = 50-200 nT/min. Dunedin is particularly responsive. Compare these observations with the effects of 1000-4000 nT/min for 100 year extreme values [Thomson et al., 2011] and ~100 A potential failure levels [Rodger et al., Space Weather, 2017]. St. Patricks Day Storm 2015 68.6 nT/min event HalfWay Bush South DunediN
MBIE project goals 1. Understand the occurrence of GIC in the New Zealand electrical transmission network. • what is happening in space to cause the mosteffective GIC in the NZ network? • could this be used to provide better forecasting? 2. Test Transpower's existing GIC mitigation protocols • how well will these work? • would other approaches work better? 3. Predict the likely impact of severe/extreme geomagnetic storms in the New Zealand grid. • identify likely hotspots, changes with solar conditions. Mitigating Emerging Risks to New Zealand's Electrical Network
Thankyou! Daniel, Craig and James at the Halfway Bush (HWB) substation in front of HWB T4 which was lost on 6 November 2001 [5 May 2015]. Mac Manus, D H, C J Rodger, M Dalzell, A W P Thomson, M A Clilverd, T Petersen, M M Wolf, N R Thomson, and T Divett, Long term Geomagnetically Induced Current Observations in New Zealand: Earth return Corrections and Geomagnetic Field Driver, Space Weather, 15, 1020–1038, doi:10.1029/2017SW001635, 2017.
Haywards 100% HVDC link Benmore 5-8% 92-95% =LEM Summary HVDC Stray Currents By doing the corrections for all LEM sites, we can work out the significance of the stray HVDC Earth return currents Transpower believes they have instrumented all the locations where this is significant). Operation in Earth-return mode (ranges from 36-99% of the year from 2001-2015). Typically carries 150-1050 A.
Haywards 100% HVDC link Benmore 5-8% 92-95% =LEM HVDC Stray Currents Max HVDC operation is ~3000 A.