Sprinkler Application Rates & Soil Considerations
480 likes | 705 Vues
Sprinkler Application Rates & Soil Considerations. Bruce Sandoval, P.E . Irrigation Engineer USDA-NRCS . Sprinkler Application Rates & Soil Considerations. Sprinkler Application Rates Soil Infiltration Rates Application vs. Infiltration = Runoff ? Management to Eliminate/Reduce Runoff.

Sprinkler Application Rates & Soil Considerations
E N D
Presentation Transcript
Sprinkler Application Rates & Soil Considerations Bruce Sandoval, P.E. Irrigation Engineer USDA-NRCS
Sprinkler Application Rates & Soil Considerations • Sprinkler Application Rates • Soil Infiltration Rates • Application vs. Infiltration = Runoff ? • Management to Eliminate/Reduce Runoff
Application Rates & Application • Instantaneous • Average • Total Application RATES
Impact Sprinkler Pattern Instantaneous Application Rate where water is hitting the ground Area being watered: Average Application Rate
Impact Sprinkler:Pattern Profile of Average Application Rate
Total Application for a Single Impact Sprinkler Total Application = Average Rate x Run Time • IF • Nozzle q = 5 gpm • Nozzle throw = 45 ft • THEN • The average application rate over the area to which water is applied (the green circle) is 0.076 inches/hour (if all the water makes it to the ground) • AND SO • If the sprinkler is run for 10 hours TOTAL APPLICATION is 0.76 inches
Instantaneous Application Rate Depends on Where The Evaluation Point is Serrated Deflection Plate
Instantaneous Application Rate Flat Deflection Plate Nozzle Water hitting ground in most of outside part of area
Exaggerated Rotator-style Pattern w/ 4 individual streams Instantaneous Application Rate Where water is Hitting the ground Area of Average Application Rate
Total Application for a Single Applicator Total Application = Average Rate x Run Time • IF • Nozzle q = 5 gpm • Nozzle throw = 25 ft • THEN • The average application rate is 0.245 inches/hour • AND SO • If the sprinkler is run for 10 hours TOTAL APPLICATION is 2.45 inches (if all the water makes it to the ground)
Reality Check:Consider Overlap & Sprinkler Movement • Individual Patterns are Overlapped for Uniformity • Typical hand/wheel line spacing of 40’ (& 50’ or 60’ in solid sets) • Adjacent applicators on a pivot/linear-move • Consider the movement of the pattern as the pivot/linear-move advances • the instantaneous application rate the soil “sees” will change because the overlapped pattern is not perfectly uniform • Initially the soil “sees” a small rate, gradually getting more intense until it peaks, then gradually decreases again as the machine moves away
Wetted Diameter Instantaneous Application Rate Varies as Machine Moves over the field Application Rate Soil One point in the field
Instantaneous Application Rates under a pivot or linear-move 8.0 Shapes also represent overlapped pattern 7.0 6.0 Low Pressure Spray 5.0 4.0 Application Rate (in/hr) Moving Applicator 3.0 Low Pressure Impact 2.0 High Pressure Impact 1.0 0.0 0 12 24 36 48 60 72 Water Application Time (min)
Application Rate Summary • Instantaneous Application Rate is the rate “seen” by the soil at one point in the field at one point in time – NOT influenced by speed of machine • Average Application Rate is the average rate “seen” by the soil at one point in the field over the time it receives water– NOT influenced by speed of machine • Total Application is total “depth” of water received by the soil in the field. Equal average rate x time watered
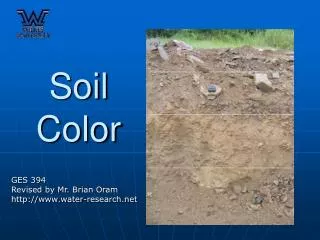
Soil Infiltration Rates • Vary with Soil Texture • Vary with Soil Structure • Vary with time • Short term • Long term • Vary with other factors
Soil texture defined by relative percentages of sand, silt, & clay
Infiltration Rate Varies With Time 5.0 Initial Rate is high 4.0 3.0 Sandy soil INFILTRATION RATE, (in/hr) Rate Drops Rapidly 2.0 Silty soil 1.0 0.0 0 12 24 36 48 60 INFILTRATION TIME, (minutes)
Soil Structure: arrangement & grouping of soil particles • Good structure in finer grained soils provides small cracks, or macropores, that provide infiltration capacity • Other things related to structure: • Compaction degrades structure • Organic Matter aids structure; residue at surface aids infiltration capacity • Soil and Water Chemistry can affect structure
Conditions that May Produce Surface Sealing Salts • Sodium tends to break down structure and produce “dispersed” conditions which lead to reduced infiltration rates • Calcium tends to bind particles together, improving soil structure and, thus, infiltration rates • These impacts typically seen in soils with large percentages of clay particles
Conditions that May Produce Surface Sealing Compaction/Sealing • By Equipment • By impact of water particles with soil • Intense rainstorm • Application Rate & Energy of Sprinkler Droplet; energy is basically a function of size of droplet • Silty soils more susceptible; aggregates broken down and the silt particles “float” on top, producing a seal • Effect is progressive, getting worse throughout the irrigation season • Organic or other material added to soil surface
Sealing Effect on Infiltration Rate 5.0 4.0 3.0 INFILTRATION RATE, (in/hr) 2.0 Soil before sealing 1.0 Soil after sealing 0.0 0 12 24 36 48 60 INFILTRATION TIME, (minutes)
Application vs. Infiltration = Runoff ? • There is potential for runoff when Application Rate exceeds Infiltration Rate. • Runoff will occur if “surface storage” cannot temporarily hold the water not being infiltrated.
0.3 Intake Family Curve 5.0 4.0 3.0 Instantaneous App rate “seen” by soil INFILTRATION RATE, (in/hr) 2.0 Potential Runoff 1.0 Surface Storage 0.0 0 12 24 36 48 60 INFILTRATION TIME, (minutes) Runoff Potential
Infiltration vs. Application Rates 8.0 7.0 6.0 Low Pressure Spray 5.0 4.0 Water Application Rate (in/hr) Rotating Spray 3.0 Sand 2.0 Low Pressure Impact Silt 1.0 High Pressure Impact 0.0 0 12 24 36 48 60 72 Water Application Time (min)
What can we do to eliminate/minimize runoff? Reduce Application Rates • Choose application device with lower average rate – but be careful to consider droplet size and its effect, as well as pressure & energy costs • Utilize booms to one degree or another • Zig-zag offsets • splitters • Mega-booms (structural issues to consider)
Booms: Reduction of Peak Application Rate *Varies with application device Based on data from King & Kincaid
0.3 Intake Family Curve 5.0 4.0 3.0 Instantaneous App rate “seen” by soil INFILTRATION RATE, (in/hr) 2.0 Potential Runoff 1.0 Surface Storage 0.0 0 12 24 36 48 60 INFILTRATION TIME, (minutes) Runoff Potential
0.3 Intake Family Curve 5.0 4.0 3.0 INFILTRATION RATE, (in/hr) 2.0 1.0 0.0 0 12 24 36 48 60 INFILTRATION TIME, (minutes) Reducing Application Rate • Water time is increased • Total Application is same • Application rate “seen” by soil is decreased Potential Runoff`
What can we do to minimize/eliminate runoff? Reduce Total Application per Irrigation • Less Total Application takes advantage of initially high, then decreasing, infiltration rates • Be careful! • Applying less per irrigation will actually require more seasonal water because of increased evaporation from the frequently wet soil surface. • Irrigating the entire root zone of the crop – getting water to the bottom of the root zone – is good practice. Lesser Total Applications may wet only the upper part of the root zone.
What can we do to minimize/eliminate runoff? Increase & Maintain Infiltration Rates • Choose application package that minimizes surface sealing: small droplets & low application rates • PAM…& other soil/water amendments? • Leave crop residue on & near soil surface • Deep tillage • If required, irrigate bare soil w/ small droplet and low application rate package
What can we do to minimize/eliminate runoff? Increase Surface Storage • Reservoir Tillage • more effective on flat fields than sloping (0-2%, ¾; 2-5%, ½”; >5%,1/4”) “Mini ponds” tend to break down as the season progresses • Choose application package that minimizes surface sealing; small depressions hold ponded water at soil surface; usually < 0.25” • Maximize surface residue - intercepts and temporarily holds water
Runoff Potential Eliminated 5.0 4.0 3.0 INFILTRATION RATE, (in/hr) 2.0 No Runoff 1.0 Surface Storage 0.0 0 12 24 36 48 60 INFILTRATION TIME, (minutes)