Download
1 / 53
530 likes | 671 Vues
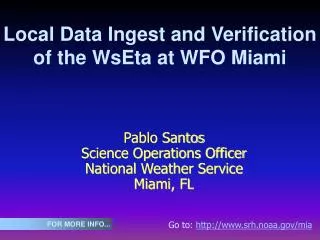
Go to: http://www.srh.noaa.gov/mia. Local Data Ingest and Verification of the WsEta at WFO Miami. Pablo Santos Science Operations Officer National Weather Service Miami, FL. FOR MORE INFO. Local Data Ingest Florida Automated Weather Network RAWS APR GPS-MET USF LAPS Analysis

E N D
Go to: http://www.srh.noaa.gov/mia Local Data Ingest and Verification of the WsEta at WFO Miami Pablo Santos Science Operations Officer National Weather Service Miami, FL FOR MORE INFO...
Local Data Ingest Florida Automated Weather Network RAWS APR GPS-MET USF LAPS Analysis Workstation Eta Temperature Forecasts Preliminary Assesment Work in progress for WPF and Temperature Go to: http://www.srh.noaa.gov/mia Outline FOR MORE INFO...
Courtesy of the University of Florida Institute of Food and Agricultural Science. Main purpose is Cold Protection. Consists of 21 Stations. Future plans call for extension of the network. Data ingested locally by FL WFOs through LDAD. Processing scripts passed on to FSL who added the network to their national mesonet database. Assimilated into their (FSL) locally run high resolution models (LAPS, MSAS, RUC20???). Data assigned official IDs and transmitted out in SHEF code via the MIARR1MIA AFOS ID from WFO Miami. Constitute first non-typical source of data ingested into FL NWS systems. Go to: http://www.srh.noaa.gov/mia Florida Automated Weather Network (FAWN) FOR MORE INFO...
Go to: http://www.srh.noaa.gov/mia Florida Automated Weather Network (FAWN) FOR MORE INFO...
Data Collected by the National Interagency Fire Center (NIFC) in Boise, ID. Over 1,500 nationwide. Used by fire agencies to predict fire behavior and monitor fuels. Data is also part of FSL’s national mesonet database. Data accessed by FL offices from FSL’s ftp server through LDAD. We provided FSL with FAWN and in exchange they gave us access to this data. Around 5 stations in interior portions of South Florida where we need it most. Go to: http://www.srh.noaa.gov/mia Remote Automated Weather Stations (RAWS) FOR MORE INFO...
Go to: http://www.srh.noaa.gov/mia Remote Automated Weather Stations (RAWS) FOR MORE INFO...
Go to: http://www.srh.noaa.gov/mia Part of the American Radio Relay League. Group of ham radio operators and other private citizens volunteering their weather data for education, research, and other interested parties. Data comes from sensors connected to computers that report the observations to a central server. This server makes the data available to FSL every 15 minutes. Part of FSL mesonet database. FL WFOs ftp the data from FSLs through their LDAD. 25-30 stations constantly report across FL (mostly SE Coast and along the I-4 corridor in Central FL). Automatic Positioning Reporting System Wx Net (APRSWXNET) FOR MORE INFO...
Go to: http://www.srh.noaa.gov/mia Network of ground based water vapor sensors using GPS receivers. Method uses dual-frequency receivers and surface meteorological sensors to measure excess GPS signal delays caused by water vapor in the atmosphere. Key parameter - IPW - integrated (total column) precipitable water vapor directly above a fixed site. Part of FSL’s national mesonet database. FL WFOs ftp the data from FSLs through their LDAD. 5 stations across FL right now. IPW - key parameter to monitor threat of flash floods. Ground Based GPS Meteorology Demonstration Network (GPS-MET) FOR MORE INFO...
Go to: http://www.srh.noaa.gov/mia Ground Based GPS Meteorology Demonstration Network (GPS-MET) FOR MORE INFO...
Go to: http://www.srh.noaa.gov/mia University of South Florida College of Marine Science. Currently 6 stations. Two more planned. CMAN type reports with Wind, Air Temp, Water Temp, Pressure, Salinity. Wrote ingest scripts and shared them with FL WFOs. Sent to FSL for their review and possible addition to their National Mesonet Dataset. Coastal Ocean Monitoring and Prediction System (COMPS) FOR MORE INFO...
Go to: http://www.srh.noaa.gov/mia Coastal Ocean Monitoring and Prediction System (COMPS) FOR MORE INFO...
Go to: http://www.srh.noaa.gov/mia Since Build 5.0 we have available to us a blacklist that enables us to specify stations and parameters to ignore for the analysis yet the data is still ingested and plotted. QC Software - Kalman Filter - turned off due to the limitations of AWIPS hardware at the present time. Quality Control FOR MORE INFO...
Go to: http://www.srh.noaa.gov/mia LAPS AND MSAS AnalysisLAPS - Local Analysis and Prediction SystemMSAS - MAPS Surface Assimilation System FOR MORE INFO...
Advent of cheaper and faster computers have enabled us to run high resolution models at the local offices. Even 12 Km NCEP Eta we do not see at the local offices due to bandwidth limitations of the SBN. Workstation Eta is version of NCEPS Eta model ran locally at Weather Forecast Offices across the nation. At WFO Miami, we run it in a 10 Km grid, Non-Hyd with 34 vertical levels. We initialize off the 06Z data with 00HR forecast starting at 12Z and out to 24 hours and off the 18Z data with the 00HR forecast starting at 00Z and out to 24 hours. This enables model output to be available early enough for day and evening shifts. Being running it since Sept., 2000. Ingested into AWIPS. Workstation Eta (Overview)
Go to: http://www.srh.noaa.gov/mia Workstation Eta (Domain) FOR MORE INFO...
Based on the experience we got late in the wet season of 2000 and last winter, it was apparent that model would be most useful as guidance/tool to help forecast short term convective initiation in the summer and also MinT in the the winter. So starting in May 1, 2001, we have been archiving the runs for a verification study of QPF forecasts through the wet season and T forecast during the winter season. For the QPF forecast, METAR, local data, as well as rain gauge data from the South Florida Water Management District (SFWMD) and the USGS are being processed for the verification analysis. KF and BMJ convective parameterization will be used. The same is being done with Temperatures. Workstation Eta (Verification)
Preliminary observation from processing data for QPF Verification: Model does not handle well situations well low levels are saturated in the morning sounding and precipitable waters values are very high (2.4 inches and above). This apparently results in high amounts of heating at low levels as convective paramerization scheme becomes active resulting in strong meso-lows developing at the surface. Tempertures: during last winter model did exceeding well helping us forecast MinT. This year, it has had a sustained warm bias in the 2m surface temperature. Workstation Eta (Verification)
00HR ANALYSIS 12HR Fcst 24HR Fcst 12Z RUNS: 5.2 1.8 4.1 00Z RUNS: 7.4 2.9 1.1 Workstation Eta Winter 2002 Preliminary Biases(Based on Comparison of Local and Metar data with interpolated point fcsts from the model grid)
24 Hr MinT Forecast Valid Jan 11, 2001 12Z 36 41 38 35 36
MIA 42 FLL 41 PBI 36 HST 36 Tamiami 35 Pombroke Pines 39 Key Biscayne 42 Pompano Beach 40 Big Cypress 32 Opa Locka 41 Hollywood 38 Preliminary results of verification to be presented at next AMS Meeting in AWIPS Sympsium. Observed Lows Across the Area
59 51 58 56 64 65
34 31 39 34 40 41
34 31 39 34 40 41
41 34 45 37 45 44
49 46 51 52 56 53
36 34 35 37 42 43
36 34 35 37 42 43
34 29 33 33 43 40