Understanding Probability Distributions: Key Characteristics and Statistical Measures
This summary delves into the essential characteristics of probability distributions, focusing on key statistical measures such as mean, median, mode, standard deviation, variance, and skewness. It explains how to interpret these measures in relation to the distribution of a random variable, exemplified by scenarios involving dice or bottles. By understanding these concepts, one can better grasp how to predict and analyze the behaviour of random variables in statistics, leading to more informed decision-making and insights into data behavior.

Understanding Probability Distributions: Key Characteristics and Statistical Measures
E N D
Presentation Transcript
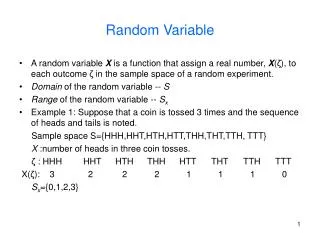
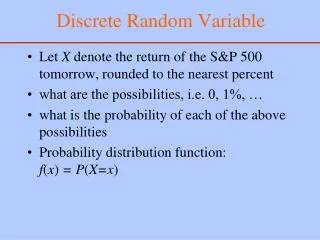
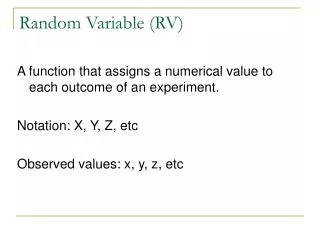
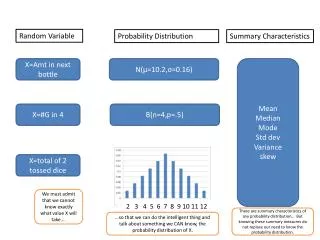
Random Variable Probability Distribution Summary Characteristics X=Amt in next bottle N(μ=10.2,σ=0.16) Mean Median Mode Stddev Variance skew X=#G in 4 B(n=4,p=.5) X=total of 2 tossed dice We must admit that we cannot know exactly what value X will take…. 2 3 4 5 6 7 8 9 10 11 12 There are summary characteristics of any probability distribution… But knowing these summary measures do not replace our need to know the probability distribution. …so that we can do the intelligent thing and talk about something we CAN know, the probability distribution of X.
Class 06: Descriptive Statistics EMBS: 3.1, 3.2, first part of 3.3
Characteristics of probability distributions Descriptive Statistics (for numerical data) • Measures of Location • Mean • Median • Mode • Measures of Variability • Standard Deviation • Variance • Measure of Shape • skewness • Measures of Location • Sample Mean • Sample Median • Sample Mode • Measures of Variability • Sample StDev • Sample Variance • Measure of Shape • Sample skewness
A positively-skewed pdf Mode is the most likely value P(X<median) = P(X>median) = 0.5 Mean is the probability-weighted average Skewness > 0
http://dept.econ.yorku.ca/~jbsmith/ec2500_1998/lecture9/Lecture9.htmlhttp://dept.econ.yorku.ca/~jbsmith/ec2500_1998/lecture9/Lecture9.html
A negatively-skewed pdf Skewness < 0
An exhibit at MOMA invites visitors to mark their heights on a wall. A normal distribution results: Well, not quite. The distribution is actually slightly negatively skewed by the confounding presence of children, who are obviously shorter than adults - you can see this in the great number of names well below the central band which are not mirrored by names higher up. Rest assured, however, that the ex-children distribution is itself Gaussian. http://www.thisisthegreenroom.com/2009/bell-curves-in-action/
The Normal pdf Mean = μ median = μ mode = μ Skewness= 0 http://www.comfsm.fm/~dleeling/statistics/notes06.html
Measures of Variability σ = 0.7 σ = 1.0 σ = 1.5 http://www.google.com/imgres?q=standard+deviation+curve&hl=en&gbv=2&biw=1226&bih=866&tbm=isch&tbnid=pppxDi8aC37y8M:&imgrefurl=http://www.comfsm.fm/~dleeling/statistics/notes06.html&docid=Hu1RM-siu0MevM&imgurl=http://www.comfsm.fm/~dleeling/statistics/normal_curve_diff_sx.gif&w=401&h=322&ei=9qAqT8KXAcPptgfC3uX0Dw&zoom=1&iact=hc&vpx=748&vpy=508&dur=1013&hovh=201&hovw=251&tx=142&ty=111&sig=106136691078404837864&page=1&tbnh=149&tbnw=186&start=0&ndsp=20&ved=1t:429,r:13,s:0
Skewed pdfs can also have different standard deviations Which pdf has the largest σ?
Pdfs Can have different means, but identical standard deviations Which pdf has the largest σ? Which pdf has the largest μ?
Characteristics of probability distributions Descriptive Statistics (for numerical data) • Measures of Location • Mean • Median • Mode • Measures of Variability • Standard Deviation • Variance • Measure of Shape • skewness • Measures of Location • Sample Mean • Sample Median • Sample Mode • Measures of Variability • Sample StDev • Sample Variance • Measure of Shape • Sample skewness Probability weighted average 50% point Most likely Expected squared distance from mean Neg if skewed left, 0 if symmetric, pos if skewed right.
Characteristics of probability distributions Descriptive Statistics (for numerical data) • Measures of Location • Mean • Median • Mode • Measures of Variability • Standard Deviation • Variance • Measure of Shape • skewness • Measures of Location • Sample Mean • Sample Median • Sample Mode • Measures of Variability • Sample StDev • Sample Variance • Measure of Shape • Sample skewness Probability weighted average =average() 50% point =median() Most likely =mode() =stdev() Expected squared distance from mean =var() Neg if skewed left, 0 if symmetric, pos if skewed right. =skew()
Characteristics of probability distributions Descriptive Statistics (for numerical data) • Measures of Location • Mean • Median • Mode • Measures of Variability • Standard Deviation • Variance • Measure of Shape • skewness • Measures of Location • Sample Mean • Sample Median • Sample Mode • Measures of Variability • Sample StDev • Sample Variance • Measure of Shape • Sample skewness Probability weighted average GET THEM ALL USING DATA ANALYSIS, DESCRIPTIVE STATISTICS, SUMMARY STATISTCS 50% point Most likely Expected squared distance from mean Neg if skewed left, 0 if symmetric, pos if skewed right.
Characteristics of probability distributions Descriptive Statistics (for numerical data) • Measures of Location • Mean • Median • Mode • Measures of Variability • Standard Deviation • Variance • Measure of Shape • skewness • Measures of Location • Sample Mean • Sample Median • Sample Mode • Measures of Variability • Sample StDev • Sample Variance • Measure of Shape • Sample skewness Probability weighted average 50% point Most likely RANGE Expected squared distance from mean Neg if skewed left, 0 if symmetric, pos if skewed right. COUNT
Understanding sample standard deviation All the data contribute to the measure. It measures variability …. In either direction. It measures variability about the mean.
Fill Test DataHistogram Data Data Analysis Histogram Check chart output 1 data point was < 9.758 2 data points were between 9.758 and 9.841 1 was above 10.673
Preview of Coming Attractions • Class 07 • Find out how to use these counts to test H0: these data came from N(10.2,.16) • Find out how to use the Denmark family counts to test H0: those data came from Binomial(4,.5)