Random Variables in Statistics
Learn about random variables, including discrete and continuous types, probability distributions, means, variances, and examples in various scenarios. Explore concepts with practical examples and diagrams.

Random Variables in Statistics
E N D
Presentation Transcript
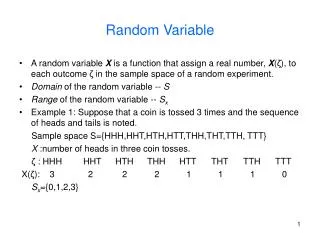
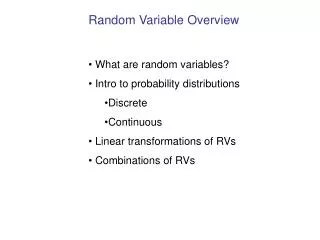
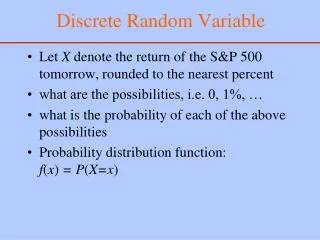
Random Variable – A random variable is a variable whose value is a numerical outcome of a random phenomenon. – A random variable is a function or a rule that assigns a numerical value to each possible outcome of a statistical experiment. Two Types: 1. Discrete Random Variable – A discrete random variable has a countable number of possible values (There is a gap between possible values). 2. Continuous Random Variable – A continuous random variable takes all values in an interval of numbers.
Examples Tossing a coin 3 times: Sample Space = {HHH, HHT, HTH, THH, HTT, THT, TTH, TTT}. Random variables : X1 = The number of heads. = {3, 2, 2, 2, 1, 1, 1, 0} X2 = The number of tails. = {0, 1, 1, 1, 2, 2, 2, 3}
Rolling a Pair of Dice Sample Space:
Rolling a Pair of Dice Random variable: X3 = Total no. of dots
Rolling a Pair of Dice X4 = (positive) difference in the no. of dots
Rolling a Pair of Dice X5 = Higher of the two.
More Examples Survey: Random variables : X6 = Age in years. X7 = Gender {1=male, 0=female}. X8 = Height. Medical Studies: Random variables : X9 = Blood Pressure. X10 = {1=smoker, 0=non-smoker}.
Probability Distribution Tossing a coin 3 times: Sample Space = {HHH, HHT, HTH, THH, HTT, THT, TTH, TTT}. Random variable : X1 = The number of heads. = {3, 2, 2, 2, 1, 1, 1, 0}
Probability Histogram Tossing a coin 3 times: Random variable : X1 = The number of heads.
Rolling a Pair of Dice Sample Space:
Rolling a Pair of Dice Random variable: X3 = Total no. of dots
Rolling a Pair of Dice Random variable: X3 = Total no. of dots 1. Pr(X3<5)= 2. Pr(3<X3<12)=
Discrete Random Variable A discrete random variable X has a countable number of possible values. The probability distribution of X where, Every piis a between 0 and 1. p1 + p2 +…+ pk = 1.
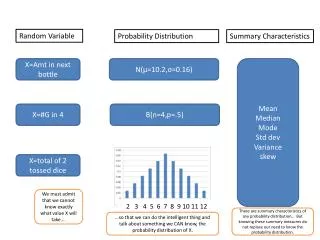
Mean of a Discrete R.V. The probability distribution of X Mean () = E(X) = x1p1+x2p2+…+ xkpk Variance (2) = V(X) = (x1-)2p1 + (x2-)2p2 + …+ (xk-) 2pk .
Continuous Random Variable A continuous random variable X takes all values in an interval of numbers. Examples: X11 = Amount of rain in October. X12 = Amount of milk produced by a cow. X13 = Useful life of a bulb. X14 = Height of college students. X15 = Average salary of UWL faculty. The probability distribution of X is described by a density curve. The probability of any event is the area under the density curve and above the values of X that make up the event.
Continuous Distributions • Normal Distribution • Uniform Distribution • Chi-squared Distribution • T-Distribution • F-Distribution • Gamma Distribution