Download
1 / 21
220 likes | 411 Vues
MA3264 Mathematical Modelling Lecture 6. Monte Carlo Simulation. Motivation. Elevator Service : Should we. assign elevators to even / odd floors?. use express elevators?. Traffic Control : Where should we locate. one way streets?. traffic lights?.

E N D
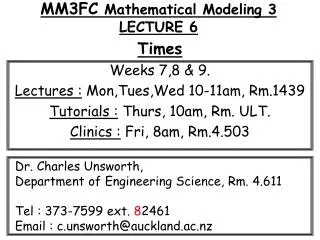
MA3264 Mathematical ModellingLecture 6 Monte Carlo Simulation
Motivation Elevator Service : Should we assign elevators to even / odd floors? use express elevators? Traffic Control : Where should we locate one way streets? traffic lights? Experimental Method : May be disruptive since upset customers may take stairs! frustrated drivers may take sidewalks! Therefore decision makers require simulation.
Random Number Generation >> m=4; n = 2; >> rand(m,n) ans = 0.9501 0.8913 0.2311 0.7621 0.6068 0.4565 0.4860 0.0185 • gives m x n matrix whose entries are independent random numbers uniformly distributed over the interval [0,1] >> x = rand(10,1); >> x = rand(10,1); >> y = zeros(10,1); >> plot(x,y,'r*') >> hold on >> x = rand(10,1); >> plot(x,y,'bo')
Random Number Generation >> x = rand(10,1); >> y = rand(10,1); >> plot(x,y,'r*') >> hold on >> x = rand(10,1); >> y = rand(10,1); >> plot(x,y,'bo') >> x = rand(100,1); >> y = rand(100,1); >> plot(x,y,'r*')
Area Under a Curve >> s = 0:.001:1; >> fs = s.^2; >> plot(s,fs,'ko') >> title('f(s) = s^2') >> count = 0; >> for j = 1:10000 if y(j) < x(j)^2 count = count + 1; end end >> area_estimate = count/10000 area_estimate = 0.3387 Question What is the area under the curve f(s) = s^2 ?
Area Under a Curve >> for m = 1:100 z = rand(1000000,2); count = sum(z(:,2) < z(:,1).^2); area_estimate(m) = count/1000000; end >> z = rand(1000000,2); >> count = sum(z(:,2) < z(:,1).^2); >> area_estimate = count/1000000 area_estimate = 0.3329 >> z = rand(1000000,2); >> count = sum(z(:,2) < z(:,1).^2); >> area_estimate = count/1000000 area_estimate = 0.3330 >> z = rand(1000000,2); >> count = sum(z(:,2) < z(:,1).^2); >> area_estimate = count/1000000 area_estimate = 0.3328 Question How does accuracy depend on # points used ?
Volume Inside of a Solid Object Problem Compute the volume of a solid that is formed by intersecting a ball of radius 1 and a cube of diameter 3/2 that has the same center as the ball? Solution Clearly the volume of the cube = 27/8 = 3.750 Therefore is suffices to compute the fraction of random points chosen inside the cube that are inside the sphere. The following MATLAB commands do the computation >> N = 10000000; >> count = 0; >> xyz = 1.5*rand(N,3)-0.75; >> radii = sqrt(xyz(:,1).^2 + xyz(:,2).^2 + xyz(:,3).^2); >> count = sum(radii < 1); >> fraction = count/10000000 fraction = 0.9212 >> volume_estimate = (27/8)*fraction volume_estimate = 3.1092
Generating Random Numbers Middle Square Method, invented by Ulam, Metropolis + http://en.wikipedia.org/wiki/John_von_Neumann 1. Start with a four digit number , called the seed. 2. Square it to obtain an eight digit number (add leading zeros if necessary). 3. Take the middle four digits as the next random number. 3084 5110 1121 2566 5843 1406 9768 4138 1230 5129 3066 4003 240 576 3317 24 5 0 >> x(1) = 3084; >> for k = 1:17 s = x(k)^2; s6 = mod(s,1000000); r6 = s6 - mod(s6,100); x(k+1) = r6/100; end Question Whats wrong? Question Where to go?
Generating Random Numbers >> x(1) = 962947; >> for k = 1:100000 s = x(k)^2; s9 = mod(s,1000000000); r9 = s9 - mod(s9,1000); x(k+1) = r9/1000; end hist(x/1000000) Question What did we do? >> x = rand(100000,1); >> hist(x) Question What method is better?
Generating Random Numbers Linear Congruence Method, invented by http://en.wikipedia.org/wiki/Derrick_Henry_Lehmer 1. Start with a four digit number , called the seed. 2. Apply the transformation Here a, b, c are three required positive integers. The random integers are between 0 and c-1. >> a = 15625; >> b = 22221; >> c = 2^31; >> x(1) = 389274; >> for k = 1:100000 x(k+1)=mod(a*x(k)+b,c); end x = x/(c-1); hist(x)
Generating Random Numbers It is often required to compute random numbers that are not uniformly distributed over an interval. Example When a dice is rolled it produces a random number in the set {1,2,3,4,5,6}, it is uniformly distributed over that (discrete) set of points. The following MATLAB commands simulates 100 throws of a dice and computes how many times each value occured. >> for k = 1:100 >> y = rand; >> x(k) = round(6*y+1/2); >> end >> for val = 1:6 >> numbers(val) = sum(x == val); >> end >> numbers numbers = 17 18 19 18 17 11
Generating Random Numbers Queueing theory models elevator (lift) and bus service. http://en.wikipedia.org/wiki/Queueing_theory The time between people consecutively arriving at an elevator or a bus stop is a random variable that is exponentially distributed over the interval This means that where is the expected value of Question How can we generate this random variable using (only) a uniform random number generator?
Generating Random Numbers Theorem If c > 0 and y is uniformly distributed over [0,1] then x = - c ln(y) is exponentially distributed over Proof The MATLAB code generates 100000 random samples >> c = 1; >> for k = 1:100000 y(k) = rand; x(k) = -c*log(y(k)); end hist(x,100) histogram of histogram of
Generating Random Numbers Theorem If is uniformly distributed over [0,1] and is independent of and is exponentially distributed with expected value 2 then and and independent and normally distributed with mean 0 and variance 1 Proof The conditions on x and y are satisfied iff
Generating Random Numbers The MATLAB commands generate 100000 samples >> for k = 1:50000 u(k) = rand; r(k) = -2*log(rand); x(2*k-1) = sqrt(r(k))*cos(2*pi*u(k)); x(2*k) = sqrt(r(k))*sin(2*pi*u(k)); end hist(x,100)
Simulating Choosing m from n People The MATLAB commands below do this % people are called 1, 2, …,n % c = vector containing chosen people % r = vector of people not yet chosen r = 1:n; for k = 1:m % compute random integer between 1 and n-k+1 j = round((n-k+1)*rand+0.5); c (k) = r(j); r(j) = r(n-k+1); r = r(1:n-k); end
Suggested Reading&Problems in Textbook 5.1 Area Under a Curve, p 177-181, Prob 5.1 5.2 Generating Random Numbers, p 177-181, Prob 5.2 5.3 Simulating Prob. Behavior, p 186-190, Prob 5.3 Recommended Websites http://en.wikipedia.org/wiki/Monte_Carlo_method http://en.wikipedia.org/wiki/Random_number_generator http://en.wikipedia.org/wiki/Queueing_theory
Tutorial 6 Due Week 6-10 October Page 181. Problem 1. Imagine that every week you purchase lottery tickets until you win a prize. Design and run a simulation program to compute the average number of lottery tickets that you purchase per week. Page 181. Problem 3. Choose a number of random points so that your estimated value of pi is accurate to about 4 significant digits Page 190. Problem 1 (not project 1)
Homework 2 Due Friday 10 October 1. Write a computer program to simulate waiting times at a bus station during rush hours using the assumptions and steps below. Run the program 200 times to generate a histogram of the waiting times that people experience and a histogram of the total number of bus arrivals. Explain in detail your logic and algorithms. a. People start to arrive at the bus station at 5:00 at the average rate of 8 per minute. They stop arriving at 7:00. The times between consecutive arrivals is exponentially distributed. For each simulation, first compute an array containing random samples of the times (in order) that people arrive between 5-7PM. b. Buses arrive promptly every 10 minutes starting at 5:10 and continue until the last passenger is picked up. Each bus arrives empty and picks up exactly 60 people. c. Each time a bus arrives the people waiting scramble to board the bus. Simulate this by choosing 60 people randomly, from among those waiting, during each bus arrival.