Download
1 / 16
170 likes | 193 Vues
Learn how to decode weather conditions using station models with symbols for temperature, wind speed, pressure, and more. Practice reading and drawing station models for accurate weather analysis.

E N D
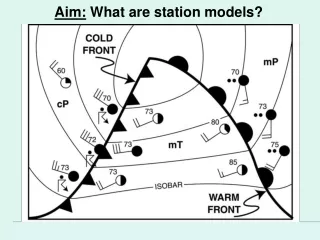
I. Station Models - Use symbols to represent weather conditions in selected locations.
A. Temperature • upper left corner (in degrees Fahrenheit).
B. Dew Point • lower left corner (in degrees Fahrenheit).
C. Wind Speed and Direction • The stick that comes off the circle is the "Wind Barb and Feathers”,which indicates speed and direction.
N S • barbs point in the direction where the windcomes from. W E Where is this wind coming from? Where is it blowing towards?
feathers show the wind speed (uses the units knots (knt), a nautical speed). • short feather = 5 knots (offset to the middle of barb) • long feather = 10 knots (offset to the end of barb) • No feathers = calm winds. 1 Knot = 1.15 mph
D. Pressure • Upper right corner in coded form. These values must be de-coded to be used. • Rules for converting pressure: • 500 and Higher • 1. Put 9 in front • 2. Move decimal one to left • Less Than 500 • 1. Put 10 in front • 2. Move decimal one to left Take the worksheet from the top back bin
E. Barometric Trend • located in the middle on the right side • Indicates if the pressure has fallen or risen over the past 3 hours. • + or / indicates the pressure has risen (increased) • - or \ indicates the pressure has fallen (decreased) • A decimal is added between the two numbers. The pressure has risen 1.9 mb in the past 3 hrs.
F. Present Weather • Left side of circle (Symbol on ESRT p.13) Air Mass abbreviations Present weather Front Symbols
G. Cloud Cover • The circle indicates the percent of cloud cover observed at the time. • Percent of circle filled = the percent of the sky filled with clouds
H. Precipitation - Shown on the bottom right. - Indicates the amount of precipitation over the last 6 hours I. Visibility - Shown on outside middle left. - Indicates how far horizontally you can see.
Station Model Codes (BACK BIN TOP WORKSHEET (ANSWERS) Meteorologists use coded data because it keeps the maps from getting filled with too much information. It is also easier to write and read without the decimal since the maps and numbers might be written small. 2) Coded 848 • Coded 180 3) Coded 111
Closure: Obtain a “Reading and Drawing Station Models” worksheet from the bottom bin. Use the notes and your ESRT to complete the worksheet for homework.