Download
1 / 14
140 likes | 269 Vues
Explore the fundamentals of climate change through an engaging series of stations. This hands-on learning experience covers key concepts in heat transfer, including conduction, convection, and the greenhouse effect. Interactive demos and animations illustrate complex ideas like the Coriolis effect and the carbon cycle. Students will analyze the roles of solar radiation in creating seasons and global warming while creating concept maps to visualize relationships between terms. Whether observing animations or conducting experiments, learners gain a comprehensive understanding of the Earth's climate systems.

E N D
Station 2: Greenhouse Effect Animation http://ccl.northwestern.edu/netlogo/models/ClimateChange
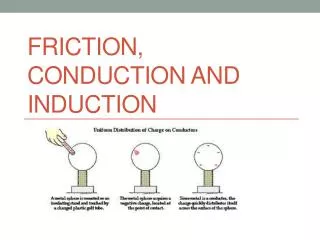
Station 3: Analysis Questions Make a concept map of the following terms: Radiation, Convection, Conduction, Absorption, Reflection, Scattering, Albedo, Electromagnetic Spectrum, Infrared rays, Visible Light, UV rays, Greenhouse Effect, Global Warming
Station 4: Coriolis Effect Demo • Clear the erasable trace-recording surface so no marks are visible. Do this by lifting up the clear, pink film on the turntable • Put the launcher on the turntable with the open end aimed towards the center. • Place the steel ball onto the top of the launcher so that it is free to roll out. • Without rotating the turntable, allow the ball to roll from the edge of the launcher across the turntable’s surface. • Sketch the trace on your data page. • Without clearing the table, turn the table counter clockwise and release the ball. • Sketch the track on your data page. • Place the launcher in the center and aim towards the edge. The launcher is now the North pole and edge is the equator. • Turn the table counterclockwise and release the ball. • Sketch the track on your data page. Compare it against previous spins. • Clear the turntable and put the launcher on the edge aiming towards the middle. • Spin clockwise and release the ball. • Sketch the track on your data page. • Place launcher in the center and aim out. Spin clockwise and release the ball. • Sketch the track on your data page.
Station 5: Carbon Cycle Animation http://www.kidsnewsroom.org/climatechange/animations.html
Station 6: Analysis Questions Insolation is a measure of the amount or intensity of solar radiation that an area is receiving. The more direct the sunlight that comes in, the higher the amount of insolation. In the space below, draw a diagram of the Earth and the sun. Include the position and tilt of the Earth at both summer and winter. In the spaces below it, explain how the seasons are created using the concept of insolation.
Station 8: Global Warming Animation http://earthguide.ucsd.edu/earthguide/diagrams/greenhouse/
Station 11: Heat Transfer Animations http://www.wisc-online.com/Objects/ViewObject.aspx?ID=SCE304
Station 14: Local Winds Animation http://www.classzone.com/books/earth_science/terc/content/visualizations/es1903/es1903page01.cfm?chapter_no=visualization