GIS and Layers
GIS and Layers. Developed by Oklahoma 4-H. Beginnings of GIS. Began in the 1960s Use was mainly in the public sector Has roots in cartography and mapping Major influence on geography in the 1980s and 1990s. Definition of GIS. G eographic I nformation S ystem

GIS and Layers
E N D
Presentation Transcript
GIS and Layers Developed by Oklahoma 4-H
Beginnings of GIS • Began in the 1960s • Use was mainly in the public sector • Has roots in cartography and mapping • Major influence on geography in the 1980s and 1990s
Definition of GIS • Geographic Information System • ESRI defines GIS as: A collection of computer hardware, software, and geographic data for capturing, managing, analyzing, and displaying all forms of geographically referenced information.
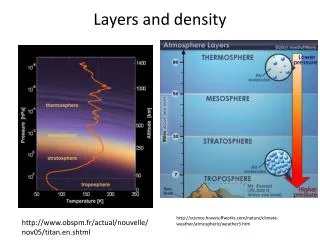
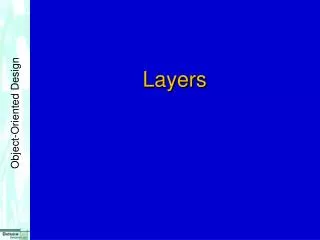
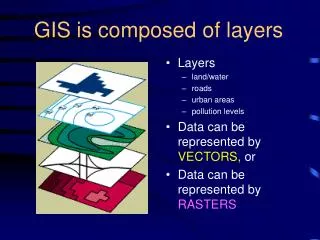
Layers • Layers are a “slice of the geographic reality in a particular area” (ESRI) • They are similar to a map legend • Layers may describe physical, biological, cultural, demographic, scale, etc. characteristics
For Example: • We have three maps (or layers) with yearly rainfall, tree species, and soil type for a specific area. • By overlaying these maps, we could determine if the amount of yearly rainfall has an effect on the type of tree that grows in certain soils.
Yearly Rainfall Tree Species Soil Type Essentially GIS uses different layers to show the relationships between data.
Components of GIS • Hardware • Computer • Software • Computer program • Data • Collected, bought, or free
Uses of Data • Find features or patterns • Quantities and density maps • Changes in a specific area • Anticipating a change (natural disaster preparedness) • Deciding or evaluating a course of action
How is it used? • Tracking the spread of disease • Mapping soil moisture • Trends in an evolving storm • Mapping Storm Water systems • Public road inventory • Precision Agriculture
Tracking the spread of the West Nile virus from ESRI Map Book vol. 19
Track of 2004 Hurricanes in Florida and Wind Speed, ESRI Map Book Vol. 21
Precision Agriculture from ESRI Map Book Vol. 20 Maturity Map Protein Map Detailed Map Maps are for Brown Rice Red is High; Purple is Low
What are other uses you can think of?
Link to ESRI map books for real life GIS maps: http://www.esri.com/industries/planning/success_stories/map_book.html
Activity • If given the following layers, what inferences or assumptions can you make from them? • Map of the U.S. with state capitals • Map of the population density • Map of interstate highways • Map of rivers in the U.S. • Average farm size in acres
All maps are from the National Atlas website located at: www.nationalatlas.com This site allows you to use different layers to create maps.