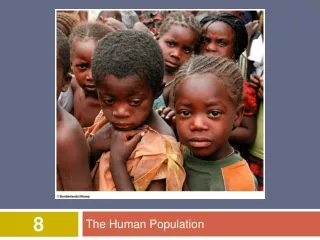
The human population and its impact
900 likes | 1.12k Vues
The human population and its impact. Ch. 6. Quick Write – Core Case Study pg. 122 Answer in complete and well thought out sentences. Describe the three factors have lead to the rapid increase in population growth?

The human population and its impact
E N D
Presentation Transcript
Quick Write – Core Case Study pg. 122Answer in complete and well thought out sentences • Describe the three factors have lead to the rapid increase in population growth? • Look at figure 6-1. In about 1,000AD there was a drop in population growth that nearly wiped out the human population. Give a logical explanation as to what might have had this effect on our population. • Doubling time means how fast (number of years) the population doubles in size. What was the doubling time between 1 billion to 2 billion people? 2 billion to 4 billion? 4 to 8 billion (if 8 billion is reached in 2025 as estimated by the UN)?
National Geographic – 7 Billion • https://www.youtube.com/watch?v=sc4HxPxNrZ0
Current population growth trends • The world’s population is currently growing about 1.2% per year. • This adds about 3 people every second. count to 10. About how many people have been born in that time?
Calculating Population Growth • If the population was at 50,0000 and grew at a rate of 1.2% per year, what would the population be the following year? • If the population was at 7 billion and grew at a rate of 1.2% per year, what would the population be the following year?
Calculating Population Growth • If the population was at 50,000 and grew at a rate of 50% per year, what would the population be the following year? • If the population was at 50,000 and grew at a rate of 100% per year, what would the population be the following year?
Developed vs. Developing Country • Developing countries are defined according to their Gross National Income (GNI) per capita per year. (how much money is made per person) • Countries with a GNI of US$ 11,905 and less are defined as developing (specified by the World Bank, 2012).
Developing vs. Developed Countries • Lower standards of living • Small economy Ex: Egypt, Pakistan, Ukraine, Mexico, Turkey, Brazil, South Africa, India, Argentina, Afghanistan, CHINA • Higher standards of living • Large economy Ex: Sweden, Germany, Ireland, Canada, New Zealand, Australia, USA http://www.worldbank.org/en/country/china/overview
Global village of 100 people • 50 males • 50 females • 61 Asians (19 from China 18 from India) • 15 Africans • 10 Europeans • 9 South American • 5 North Americans (including the most powerful man, the US President)
Global village of 100 people • 26 would be under 14 years old (pre-reproductive stage) • 8 are 65 years and over (post-reproductive stage) • 66 between the ages of 14 and 65 (reproductive stage)
Global village of 100 people • 82 would be from less developed countries with an average income of US$ 5,440 in a year ($15 a day), but 51 of those would live on less than $2 a day 18 would be from developed countries with an average income of US$ 32,470 in a year ($90 a day)
Global village of 100 people • 40 would lack access to basic sanitation and 13 would lack access to safe drinking water. • There would be 77 mobile phones, but unequally distributed, some would have 2 or more cell phones, other none. • 33 would be Internet users, 15 would have Internet access from home and 12 would be active users of Facebook.
Global village of 100 people • 17 would be overweight • 13 would suffer from malnutrition. • 10 would have no job • 11 would have cars or light trucks • 7 would be unable to read and write (age 15 and over) • 7 would have a college education. • Half of the entire village's wealth would be in the hands of only 6 people, and most of them would be citizens of the United States.
In general… • The global wealth and resources are pretty unevenly distributed. • If you live in the United States, you have it pretty well off compared to others around the world.
Warm Up 11/18/2014 • There are 7 million people in the world. If the population grew at a rate of 1.2% how many people would be added to the population over 13 years? • What are three population growth trends occurring in the world right now? • What is the difference between developed and developing countries? What % of the world is developed? Developing? • What are the two most populous countries in the world?
3 Population Growth Trends • Overall the world population growth has slowed down (currently about 1.2%) • Population growth is unevenly distributed around the world. • Of the new 84 million people in 2012, 2% were from developed countries and 98% were from developing countries. • Three most populous countries are: China (19%), India (18%), United States(5%)
3 Population Growth Trends • More than half of the world’s population now live in urban areas (cities). • 21 mega cities with over 10 million people • People are moving from rural to urban areas.
How many people can the earth support? • What is the carrying capacity of the earth? A BETTER QUESTION WOULD BE: • What is the cultural carrying capacity?
Cultural Carrying Capacity • The number of people who can live in reasonable freedom and comfort without decreasing the ability of the earth to sustain future generations
Measuring Population Growth • How can we calculate population change? Population change = (births + immigration) – (deaths + emigration) • Calculating total births and deaths is a large number. • Crude birth rate – number births per 1,000 people • Crude death rate – number deaths per 1,000 people
Measuring Population Growth • Fertility Rate – how many children are born in a population over a set period of time. Replacement fertility rate- the average number of children parents must have to replace themselves and the whole population.
Replacement Fertility Rate • Globally, this number is slightly higher than 2 children per couple. WHY do you think this is? • About 2.1 children/woman in developed countries • About 2.5 children/woman in developing countries
Total Fertility Rate (TFR) • The average number of children born to a women in her reproductive years. • Between 1955 and 2012 (57 years): • In more-developed countries TFR dropped from 2.8 to 1.6 • In less- developed countries TFR dropped from 6.2 to 2.5
Total Fertility Rate (TFR) The world population is still growing exponentially, But what are some things you think may have contribute to a slowing down of the world’s population growth? Open to page S44 and S45 in the supplement section towards the back of the book.
Fertility Rate Factors • 1 Child labor force • In less developed countries children are uses to help with field work, tending live stock, hauling water, cooking etc.
Fertility Rate Factors • In developed countries children do not enter the work force until their late teens or twenties. • It cost about $235,000 - $304,000 to raise a middle class child from birth to age 18. 2 Cost of raising and educating children
Fertility Rate Factors 3 Number of Infant deaths • In countries with poor sanitation, lack of nutrition and health care there is a higher rate of infant mortality. • Therefore women tend to have more babies within their life time. • In 1960 the women in Bangladesh had 7 children on average!
Fertility Rate Factors 3 Number of Infant deaths • In countries with low infant death rates women tend to have less children because their children live through infancy. • Average of 4 million infants die a year from ‘preventable’ causes (average of 11,000 per day)
Fertility Rate Factors 4 Life Expectancy • The average number of years a person would be expected to live. • Global life expectancy has increase from 48 years to 70 years. • In countries with longer life spans and fewer infant mortalities women tend to have less children • Average USA life span is 79 years old.
Fertility Rate Factors 5 Women Empowerment • Women with access to education and work opportunities tend to have less children • Women without a high school education and opportunities outside of the house tend to have more than two children
Fertility Rate Factors 5 Woman Empowerment • In Africa, Latin America and Asia, women do 60-80% of work associated with growing food, gathering, hauling wood and water. • Most of this is unpaid work! • Globally 300 million school aged girls do NOT attend school (3 times the entire USA population) and cannot read or write. • As women become empowered they take charge of their life and reproductive behavior
Fertility Rate Factors 6 Religious beliefs, traditions and cultural norms • In some cultures having a large family is encouraged! • Ex: Muslims believe Allah, their god, wants them to have many children
Fertility Rate Factors 7 Average age of marriage and family planning • In developed countries women get married at a older age and have education in family planning. • The availability of abortions and reliable birth control allows women to control the number of children they have. • Each year about 210 million women become pregnant and about 42 million have abortions (22 million legally and 20 million illegally) according to the World Health Organization.
Warm Up 11/19/2014 • What is cultural carrying capacity? • What is the difference between birth rate and crude birth rate? • Explain the measurement of fertility rate and the two types of fertility rates. • What is the estimated growth rate of the human population today? • Name 3 factors that impact fertility rates and human population growth and explain how they do so.
Fertility Rate Factors • Child labor • Cost of raising and educating a child • Infant mortality • Life Expectancy • Woman Empowerment • Religious beliefs, traditions and cultural norms • Age of marriage and family planning
Article Discussion • On the back of your article, summarize the main points and topics in 5-10 sentences. • Explain your article to your neighbor and discuss the questions you answered last night. (3 minutes each) • Create two questions pertaining to your neighbor’s article, that you would like to know more about. • Reflect. What do you personally think, feel or believe about the moral, ethical, social or legal ways population growth and fertility rates have been dealt with by both Afghanistan and China.
Fertility Rate Articles Afghanistan China • Read the article and underline or highlight the main ideas. • Answer the following in complete and well thought sentences: • How has this country tried to regulate their population growth? • What have been the results of their efforts? • Do agree or disagree with their methods? Why?
China’s One Child Policy • Put into effect in 1979, Chinese families were only allowed to have one child. • This was in response to a famine that occurred in the 1970’s due to a rapid population growth rate. At that time fertility rate was about 7.5
China • Consequences of One-Child Policy https://www.youtube.com/watch?v=D0BPWFnL_jY • Forced Abortion https://www.youtube.com/watch?v=JjtuBcJUsjY
Thinking Points • What benefits have come from China’s one child policy. • What problems have come, and are expected to come, from China’s effort to control it’s population. • Do you think China should keep their one-child policy? Why?
Afghanistan/Islam • Birth rate is around 5.5 children per woman. • Dude to low sanitation and health care many children and woman may die during or shortly after childbirth. • Tradition, culture and religion (Islam) contribute to high fertility rates.
Map and Data Analysis • Open to page S44 and S45 in the supplement section towards the back of the book. • Look at all three maps. • Discuss with your neighbor the answers to the questions under each map.
Effect of Age Structure on Population Growth Age structure – the number or percent of males and females in young, middle and older age groups. • Pre-reproductive (0-14) • Reproductive (15-44) • Post-reproductive (over 45)
Effect of Age Structure on Population Growth • Age structure can be used to predict the future population growth of that country. Important factors of age structure: • Number and proportion of individuals in each age group. • The number of males versus the number of females in each age group.
Age Structure Diagrams • From the age structure data, a diagram can be created to help predict the future growth of a population Age Structure Diagrams can tell you: • If a population is increasing, stable or shrinking • Population growth momentum- even if people are having less children, the effect won’t take place until much later when the children reach reproductive maturity
There are three scenarios: 1. Expanding/growing population- pyramid shape, has more children than any other age group.- Nigeria, Kenya, United States 2. Stable populations- Number of children is roughly the same as the number of reproductive adults- European countries 3. Declining population- diamond shape, Pre-reproductive group is smaller that the elder - Russia, Bulgaria and Germany