Download
1 / 22
220 likes | 390 Vues
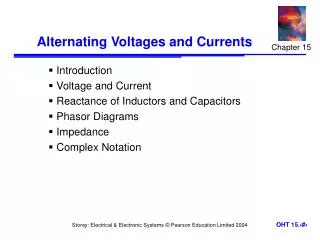
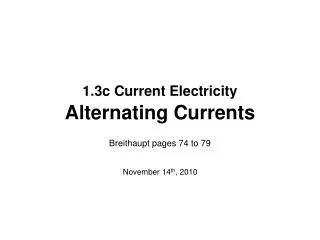
Alternating voltages and currents. Alternating Potential Differences. a.c. supply. Most alternating voltages vary “sinusoidally”. Hence the wavy symbol!. The period T of the p.d. is the time taken for one complete wave or (cycle). p.d. time. The frequency of the supply is 1/T.

E N D
Alternating Potential Differences a.c. supply Most alternating voltages vary “sinusoidally”. Hence the wavy symbol!
The period T of the p.d. is the time taken for one complete wave or (cycle). p.d time The frequency of the supply is 1/T. So the frequency (f) of the supply is equal to the number of cycles in a second. The mains frequency in England is 50Hz .
Finding an average value for the a.c. current Current 0 time The size of the current follows a similar pattern to the p.d. We need to be able to say what the “average” current is. If we take a simple mean for the current we get a value zero!
Measuring an a.c. current R R Ia.c. Ia.c. We compare the magnitude of the current in an a.c. circuit with that in a d.c. circuit. We do this in terms of the power dissipated through an exactly equal resistance. R Id.c.
Same resistor in d.c. circuit resistor in a.c circuit R R When the power output from the two resistors is exactly the same we say that exactly the same current is flowing through the two resistors. The power formula tells us that power is the product of current and voltage P =IV In this form this relationship doesn’t help much as I and V in the a.c. circuit are both varying continuously. However substituting for V using V=IR yields P= I2R And the power through a given resistance can be seen to depend only on the current
resistor in d.c. circuit resistor in a.c circuit R R R P=(Iac)2R So the power through the resistor must be proportional to the average value of I2 P=I2R This says that the power through the resistor is proportional to I2 This value is the root mean square current
Root mean square value of the current Current /I I0 Irms Time t It can be shown for a sine curve it can be shown that:
I2 mean square value i.e. average (I)2 value of the current (Irms)2
Sinusoidal voltage A similar argument for sinusoidal voltage change gives a similar result Voltage / V Root mean square value of the voltage V0 Vrms Time t
Peak to Peak Voltage Peak to peak voltage Voltage / V V0 0 Time t
Peak Voltage Peak voltage In this case the peak voltage is equal to the amplitude of the wave Voltage / V V0 0 Time t
Peak Voltage Peak voltage In this case the peak voltage is not equal to the amplitude of the wave Voltage / V 0 Time t This diagram illustrate the difference between peak voltage and amplitude.
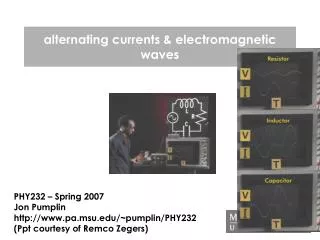
The oscilloscope • The oscilloscope is a simple means of producing p.d/ time graphical displays. • It is an immesly powerful tool becausse it can be used to capure very small intervals of time and tiny voltages.
The time interval represented by the horizontal distance across one square is (in this case) 0.2 s The horizontal distance is referred to as the “time-base”. It takes the spot 0.2 seconds to travel this distance at this setting
The p.d. scale on the oscilloscope is +1V per square The p.d, between the input terminals of the oscilloscope is zero volts
The p.d. input read by the oscilloscope is -1V i.e the input terminals of the oscilloscope have been reversed.
An a.c voltage is represented by a sinusoidal wave. On a time base of 1 ms with a voltage scale of 5V, What is the frequency of the a.c. signal? What is the peak voltage of the signal? The potential of the mains electrical supply oscillates in this way at a frequency of 50 Hz. This potential drives a current with the same frequency