Download
1 / 47
581 likes | 894 Vues
75 Laurel Street Carbondale, PA 18407 Tel. (570) 282-4947 Cell (570) 575-9252. Transient Speed Vibration Analysis Insights into Machinery Behavior 07-Dec-2007. By: Stan Bognatz, P.E. President & Principal Engr. srb @ mbesi.com.

E N D
75 Laurel Street Carbondale, PA 18407 Tel. (570) 282-4947 Cell (570) 575-9252 Transient Speed Vibration AnalysisInsights into Machinery Behavior07-Dec-2007 By: Stan Bognatz, P.E.President & Principal Engr.srb@mbesi.com Rotating Machinery Diagnostics & Instrumentation Solutions for… “Maintenance That Matters” www.mbesi.com
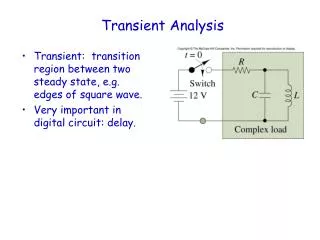
Ok, analysts…. • What is wrong with this turbine? Transient Vibration Analysis / Vibration Institute Meeting Halifax, NC 07-Dec-2007
Possibilities • What causes a predominant 1X Vibration? • Unbalance • Misalignment • Rotor Resonance • Structural Resonance • Rub • Coupling Lock Up • Oversize bearing • Bowed Shaft • High 1X Slow Roll / Runout • Cracked Shaft Transient Vibration Analysis / Vibration Institute Meeting Halifax, NC 07-Dec-2007
Transient Vibration Analysis • Transient Speed Vibration Analysis • Acquisition & analysis of data taken during startup and shut down • Provides significant insight into the rotor and structural dynamics that cannot be had with only steady state analysis • This information includes: • Unbalance “Heavy Spot” Locations • Rotor Mode Shapes • Shaft Centerline Movement / Alignment • Bearing Wear • Shaft Runout • Critical Speeds / Resonances • Rotor Stability • Bearing Wear • Foundation Deterioration, and others Transient Vibration Analysis / Vibration Institute Meeting Halifax, NC 07-Dec-2007
Transient Data Sampling • This is not ‘PdM’ data acquisition • Multiple channels (8 – 30+) • All channels sampled simultaneously & synchronously • All data referenced to a once-per-revolution speed / tach signal Transient Vibration Analysis / Vibration Institute Meeting Halifax, NC 07-Dec-2007
Instrumentation • What are some instrumentation requirements for transient data? • Here’s a “short” list of desired abilities for transient data acquisition: • Minimum channel count of 8, with 16 or more channels preferred • Synchronous sampling of all channels • 2 or more tach channels • Accurately sample data at low rotor speeds (< 100 rpm) • Measures DC Gap Voltages up to -24 Vdc • Produce DC-coupled data plots (for shaft centerline & thrust data) • Provide IEPE / accelerometer power • Electronically remove low speed shaft runout from at-speed data • Display bearing clearances; plot shaft movement with available clearance • Specify RPM ranges for sampling, and RPM sampling interval • Produce bode, polar, shaft centerline, and cascade plots for data analysis • Tracking filter provides 1X and other programmable vector variables Transient Vibration Analysis / Vibration Institute Meeting Halifax, NC 07-Dec-2007
The Need for (Rotor) Speed • A key (the key) component to successful transient analysis is a reliable once-per-revolution tachometer signal • This signal provides a triggering pulse for the instrument tracking filter • It lets us establish a rotor phase angle reference system • For machines without a permanent vibration monitoring system, a portable laser tachometer can be used to provide a TTL pulse • We have had excellent results with Monarch Instrument’s PLT-200 • Observes optically reflective tape attached to the shaft • Senses optical tape 25’ away feet at angles of 70°! • Clean TTL pulse output • Very reliable trigger • Use with ZonicBook/618Ededicated Tach inputs Transient Vibration Analysis / Vibration Institute Meeting Halifax, NC 07-Dec-2007
The Need for (Rotor) Speed • Machines with permanent vibration monitoring systems often use a proximity probe to observe a notch or keyway in the shaft • This provides a DC voltage pulse output • Signal must used as an analog tach input on the ZonicBook/618 • Some signals create triggering problems due to signal quality: • Overshoot / ripple – causesmultiple triggers per revolution • Overall signal contains anAC vibration signal – causes multiple triggers • The bottom of eachpulse is not at the same voltage level – causes misses samples Transient Vibration Analysis / Vibration Institute Meeting Halifax, NC 07-Dec-2007
The Need for (Rotor) Speed • If your instrumentation does not properly trigger using Auto tach: • Try manually adjusting the trigger voltage level to a voltage that only allows the instrument to that voltage level and corresponding slope (+ or -) once per revolution • A trigger setpoint of -2.0 to -3.0 Vdc would work nicely here Transient Vibration Analysis / Vibration Institute Meeting Halifax, NC 07-Dec-2007
The Need for (Rotor) Speed • If reliable triggering cannot be established, a signal conditioner such as Bently Nevada’s TK-15 Keyphasor Conditioner can be used to modify the signal • It can simultaneously ‘clip’ the top and bottom portions by applying bias voltages, thus removing any ripple / overshoot from the pulse, and producing a more TTL-like pulse • The signal can also be amplified Transient Vibration Analysis / Vibration Institute Meeting Halifax, NC 07-Dec-2007
Transducer Selection vs. Machine Design • Journal & Tilt Pad Bearings: • Machines with heavy /rigid casings, and ‘light’ rotors • Most steam turbines, barrel compressors, gearboxes, large pumps, etc. • Proximity Probes in X-Y Configuration at each bearing • Provide direct measurement of shaft-relative vibration • Seismic probes (accels) yield attenuated signals & phase lag • Machines with lower case-to-rotor mass ratios or flexible supports • Gas turbines, LP turbine pedestals, air machines, fans, pumps, motors • Use Proximity & Seismic when possible • Flexible supports provide comparableshaft & casing vibration – both areimportant • Rolling-Element Bearings: • Accelerometers • True Vertical & Horizontal Planes • Aligns probes close to major &minor stiffness axes Transient Vibration Analysis / Vibration Institute Meeting Halifax, NC 07-Dec-2007
Configuration & Sampling Guidelines • ΔRPM & ΔTime Sampling Intervals • Generally sample at ΔRPM of 5 to 10 rpm for most machinery • Produces high quality data plots • Keeps database sizes reasonable • Need to consider the total speed range over which data must be sampled • Will speed will oscillate during the startup? • Turbine startups; VFD drives • ΔTime sampling during startup provides data during heat soak / idle periods • 20 to 30 seconds between samples, unless process conditions are changing rapidly • Try to estimate total database size required and ensure system will not truncate database during sampling Transient Vibration Analysis / Vibration Institute Meeting Halifax, NC 07-Dec-2007
Configuration & Sampling Guidelines • Fast Ramp Rates – AC Motors • Induction motor startup will be very fast, accelerating quickly and smoothly from zero to full speed • Startup lasts only 10 – 40 seconds after the breaker is closed • Can data acquisition keep pace with the ramp rate? • 3,600 rpm motor; 40 second startup time • 3600 / 40 = 90 rpm per second • At ΔRPM = 5, we would be trying to capture = 16 samples per second • What can we expect from our data? • Examine data acquisition settings: • Fmax • Lines of resolution • ZonicBook/618E: 2,000 Hz Fmax; 1600 LOR • 1 sample = 0.8 seconds = 72 rpm change between start and end of sample • Data smearing • Fmax = 1,000 Hz; 200 LOR • 1 sample = 0.2 seconds = 18 rpm • Set ΔRPM at 20 - 30 Transient Vibration Analysis / Vibration Institute Meeting Halifax, NC 07-Dec-2007
Transient Data Plot Types • Bode • Polar • Shaft Centerline • Waterfall / Cascade • Before discussing these data plots, we need to review the importance of slow roll compensating our 1X-filtered shaft vibration data to remove the effects of runout Transient Vibration Analysis / Vibration Institute Meeting Halifax, NC 07-Dec-2007
Slow Roll Compensation • Slow-roll: mechanical and electrical shaft runout in the target area of a proximity probe • Defects that create a non-dynamic ‘false’ vibration signal • Adds vectorally to the true dynamic vibration at any speed • Prox probe cannot distinguish between runout and true vibration • We need to electronically remove slow roll for accurate results • For most turbo-machinery: • Sample vibration at low speeds, typically below 300 rpm • Reasonably sure there will be little dynamic shaft motion • The measured signal will contain the runout of the probe target area • Most data acquisition systems allow runout signal to be store and then digitally subtract it from any at-speed vibration • The differences can be dramatic…. Transient Vibration Analysis / Vibration Institute Meeting Halifax, NC 07-Dec-2007
Slow Roll Compensation • Time-waveform plot • Uncompensated • Dominant 1X signal, some 2X • Compensated • Significant 2X • Different conclusions? Transient Vibration Analysis / Vibration Institute Meeting Halifax, NC 07-Dec-2007
Slow Roll Compensation • Selecting the Correct Slow Roll Speed Range on a Bode Plot • Look for low speed region with constant amplitude and phase • This ensures we are not including any ‘true’ dynamic activity • Effect on Bode plot • Cannot predict how the bode plot will look like after compensation • Amplitude should be near zero at the speed the slow roll was sampled Transient Vibration Analysis / Vibration Institute Meeting Halifax, NC 07-Dec-2007
Slow Roll Compensation • Polar Plot Compensation • Slow roll vector merely moves the entire plot • “Shape” of the data (polar loops) not changed • Can be done visually • Properly compensated plot will begin at zero amplitude Transient Vibration Analysis / Vibration Institute Meeting Halifax, NC 07-Dec-2007
Transient Data – Bode Plots • Bode plots typically show the 1X vector response in X-Y format • Filtered Amplitude • Phase Lag Angle • Rotor Speed Transient Vibration Analysis / Vibration Institute Meeting Halifax, NC 07-Dec-2007
Bode Plots • They help provide the following information: • Slow roll speed range & slow roll vector values • The location of the “High Spot”, i.e., the rotor’s vibration response • The location of the “Heavy Spot”, i.e., the physical location of a residual unbalance on the rotor • Amplitude, phase & frequency of rotor and structural resonances • The presence of ‘split’ resonances • Amplification Factor, Damping Ratio & Separation Margin for a resonance Transient Vibration Analysis / Vibration Institute Meeting Halifax, NC 07-Dec-2007
Heavy Spot ~90° 181° Phase at Resonance Resonance 3.39 mils at 1,810 rpm Bode Plots • Resonance information • Amplitude – peaks at resonance • Phase – must show a 90 degree shift from low speed • Starting point can be difficult to determine if other modes are present • Frequency (rpm) Transient Vibration Analysis / Vibration Institute Meeting Halifax, NC 07-Dec-2007
High Spot Heavy Spot ~90° Phase Response Bode Plots • The “High Spot” = the measured 1X vibration response • Changes as a function of speed • The “Heavy Spot” = physical location residual rotor unbalance • Hopefully doesn’t change • Relationship to High Spot depends on whether the rotor operates below, near, or above its resonance Transient Vibration Analysis / Vibration Institute Meeting Halifax, NC 07-Dec-2007
HighSpot Heavy Spot ~90° 181° Phase at Resonance Resonance 3.39 mils at 1,810 rpm 3.39 x .707 = 2.4 mils 2.4 mils N2 ~1,870 rpm N1 ~1,750 rpm Bode Plots • Amplification Factor (AF) a measure of damping for any mode • API Half-Power Bandwidth Method: • Multiply (peak amplitude x 0.707) • Determine corresponding speeds N1 & N2 == half-power bandwidth • AF = resonance frequency divided by half-power bandwidth AF = 1810 / (1870-1750) AF1 = 15.1 !! Transient Vibration Analysis / Vibration Institute Meeting Halifax, NC 07-Dec-2007
HighSpot Heavy Spot ~90° 181° Phase at Resonance AF = 1810 / (1870-1750) AF1 = 15.1 !! Resonance 3.39 mils at 1,810 rpm 3.39 x .707 = 2.4 mils 2.4 mils N2 ~1,870 rpm N1 ~1,750 rpm Bode Plots • Amplification factor API guidelines: • < 2.5 = Critically damped; essentially no resonance seen • < 5.0 = very good • < 8.0 = still acceptable • 8 – 10 = marginal • > 10 = poorly damped Transient Vibration Analysis / Vibration Institute Meeting Halifax, NC 07-Dec-2007
HighSpot Heavy Spot ~90° 181° Phase at Resonance Running Speed = 3,600 rpm AF = 1810 / (1870-1750) AF1 = 15.1 !! Resonance 3.39 mils at 1,810 rpm 3.39 x .707 = 2.4 mils 2.4 mils SM = (3600 – 1810) / 3600 SM = 49.7% N2 ~1,870 rpm N1 ~1,750 rpm Bode Plots • Separation Margin - API guidelines: • AF < 2.5: critically damped; no SM required. • AF = 2.5 - 3.55: SM of 15% above MCS & 5% below MOS • AF > 3.55 & resonance peak < MOS: • SM (%MOS) = 100 - {84 + [6/(AF-3)]} • AF > 3.55 & resonance peak > trip speed: • SM (%MCS) = {126 - [6/(AF - 3)]} - 100 Transient Vibration Analysis / Vibration Institute Meeting Halifax, NC 07-Dec-2007
Rotation Phase Angle Probe angle Amplitude Polar Plots • Polar plots (Nyquist diagrams) present the same information as bode plots, graphing amplitude, phase, and frequency • Data is plotted in polar (circular) coordinates • Direction of rotation Transient Vibration Analysis / Vibration Institute Meeting Halifax, NC 07-Dec-2007
Polar Plots • Key advantages over bode plots: • Easier data interpretation - resonances appears as loops • Plot is oriented to the vibration probe & referenced to machine casing • Slow roll compensation is easily performed, even visually • Incorrect compensation is easily identified • The High Spot and Heavy Spot have immediate physical meaning, being directly transferable from the plot to the machine. • We can easily identify the 1st and 2nd rotor modes and determine the ideal locations / planes for balance weights • Structural resonances are easy to identify • Speed normally increases opposite the direction of rotation, providing precessional information Transient Vibration Analysis / Vibration Institute Meeting Halifax, NC 07-Dec-2007
90° Polar Plots • Resonances (rotor & structural) appear as loops • Same amplitude peak and 90 degree phase change as bode plot • Loop is easier to identify than bode plot activity • Structural resonances appear as small inner loops Transient Vibration Analysis / Vibration Institute Meeting Halifax, NC 07-Dec-2007
Balance Weight Heavy Spot Resonance Polar Plots • Heavy Spot, High Spot, and the “Balancing-T” • Heavy Spot for any resonance located in the direction the polar loop starts • Heavy Spot should be 90 degrees with rotation from the resonance peak • Phase angle well above resonance should approach 180 from Heavy Spot, and be 90 degrees against rotation from the resonance peak Transient Vibration Analysis / Vibration Institute Meeting Halifax, NC 07-Dec-2007
Balance Weight Heavy Spot Resonance Polar Plots • Heavy Spot, High Spot, and the “Balancing-T” • The Low Speed, Resonance, and High Speed data should all lead to essentially the same balance weight location. Transient Vibration Analysis / Vibration Institute Meeting Halifax, NC 07-Dec-2007
Why Do Resonances Occur? • Unbalance creates a CG that is not coincident with the geometric center • At low speeds, shaft rotation occurs around the geometric center • As speed increases, the rotor seeks to “self balance”, with the center of rotation migrating from the geometric center toward the mass center • The ‘self-balancing’ process is what occurs as we pass through resonance • At the resonance peak, rotation is centered half-way between the geometric and mass centers, resulting in maximum vibration Transient Vibration Analysis / Vibration Institute Meeting Halifax, NC 07-Dec-2007
P1 P2 1st Mode - Translational 2nd Mode - Pivotal 3rd Mode L/3 L/2 L/3 Resonances & Mode Shapes • Rotor may have more than one resonance depending on operating speed and mass distribution • Each resonance has an associated mode shape. For symmetric rotors: • 1st Mode is in-phase from end to end • Maximum deflection at rotor center • 2nd mode out-of-phase end-to-end • Maximum deflection at 1/3 points • ‘Single disks’ such as 1-stage fans and pumps will have only 1 rotor mode (if they operate fast enough) • Multi-disk (compressors, turbines, some pump) or distributed mass rotors (motors, generators) may have more than 2 modes • Do not confuse rotor mode shapes with structural mode shapes Transient Vibration Analysis / Vibration Institute Meeting Halifax, NC 07-Dec-2007
P1 P2 Polar Plots • Typical 1st and 2nd mode responses • 1st mode at 2,730 rpm – in-phase across the rotor • 2nd mode at 7,420 rpm – out-of-phase across the rotor • 2nd mode must be compensated to remove residual 1st mode effects if present Transient Vibration Analysis / Vibration Institute Meeting Halifax, NC 07-Dec-2007
1st Mode Resonance 1st Mode Resonance 1st Mode Bal. Wt. 1st Mode Bal. Wt. 1st Mode Heavy Spot 1st Mode Heavy Spot Polar Plots • 1st Mode balance solution – the classic “Static” Balance • Balance weights on both ends of rotor in same angular locations • We can balance the 1st mode without affecting the 2nd mode • The static balance weight pair will cancel each other out during the 2nd mode, having no effect on 2nd mode vibration P1 P2 Transient Vibration Analysis / Vibration Institute Meeting Halifax, NC 07-Dec-2007
2nd Mode Resonance 2nd Mode Bal. Wt. 2nd Mode Heavy Spot Polar Plots • 2nd Mode balance solution – the “Couple” Balance • Balance weights on both ends of rotor in opposite angular locations • We can balance the 2nd mode without affecting the 1st mode • The couple balance weight pair at out of phase during the 1st mode, canceling each other out • 2nd modes must be separately compensated for proper analysis 2nd Mode Heavy Spot 2nd Mode Bal. Wt. 2nd Mode Resonance P1 P2 Transient Vibration Analysis / Vibration Institute Meeting Halifax, NC 07-Dec-2007
Shaft Centerline Position • Shaft centerline plot shows the average movement of a shaft within the bearing • Plots DC gap voltage changes from X-Y proximity probes • Only applies to proximity probes • Plots should be made in relation to the available diametral bearing clearance • We must also assume a reference position (typically the bottom of the bearing for horizontal machinery) Transient Vibration Analysis / Vibration Institute Meeting Halifax, NC 07-Dec-2007
Shaft Centerline Analysis • Used Qualitatively • Look at motion paths & final positions • Shows misalignment and preloads across the machine • Used Quantitatively • Need accurate bearing clearance data! • Measure Bearing Wear • Eccentricity Ratio • Shaft Attitude Angle Transient Vibration Analysis / Vibration Institute Meeting Halifax, NC 07-Dec-2007
Eccentricity Ratio • Any forcing function placing a lateral (radial) preload on the rotor can result in a change is shaft centerline position. • Preloads can result from: • Misalignment Thermal growth • Casing Deflection • Pipe Strain • Rotor rubbing • Pumping • Gravity • Misalignment from Thermal Growth / Deflection is the main cause of excessive lateral preloading ! • We use Eccentricity Ratio as the key measure of the shaft’s response to lateral preloads Transient Vibration Analysis / Vibration Institute Meeting Halifax, NC 07-Dec-2007
Eccentricity Ratio • Eccentricity is the ratio between the distance from the shaft center to the bearing center, divided by the radial bearing clearance • Usually abbreviated as ‘e’ or ‘ER’ • Example 1: • Given: 15 mils radial bearing clearance • Shaft centerline data shows the shaft operating 3 mils from bearing center • ER = 3 / 15 = 0.2 running ‘high’ in the bearing • Example 2: • Shaft is operating 9 mils from the bearing center • ER = 9 / 15 = 0.6 typical • If the shaft is centered in the bearing, what is ‘e’? • ER = 0 / 15 = 0 • If it is against the bearing wall? • ER = 15 / 15 = 1 Transient Vibration Analysis / Vibration Institute Meeting Halifax, NC 07-Dec-2007
Average vs. Dynamic Eccentricity Ratio • The previous slides showed ‘Average’ ER. This is the shaft position obtained when we only consider the DC Gap Voltage data • If we also consider the shaft vibration at any given average position, we have the Dynamic Eccentricity Ratio • For example, given 15 mils radial bearing clearance: • If shaft centerline data shows the shaft 9 mils from bearing center,Average ER = 9 / 15 = 0.6 • Given 6 mils pk-pk of 1X shaft vibration using 200 mV/mil probes, the dynamic shaft motion varies +/- 3 mils from the average position • Dynamic ER = Avg ER +/- [(peak-to-peak vibration / 2) / radial clearance] • For our data: • Dynamic ER = 0.6 +/- [ (6 / 2) / 15 ] = 0.6 +/- 0.2 • So the Dynamic ER varies from 0.4 to 0.8 with each shaft rotation • At 0.8 we see the shaft is in close proximity to the bearing wall. We might want to reduce the vibration and/or modify the alignment to reduce babbitt stress Transient Vibration Analysis / Vibration Institute Meeting Halifax, NC 07-Dec-2007
Stiffness & Damping vs. Eccentricity • The radial stiffness and damping of the lubricating fluid within a bearing are functions of eccentricity ratio • Increased eccentricity results in non-linear increases of stiffness and damping • What effect does this have on our resonance? AF? • Observed frequency will increase • Observed AF will decrease • Practically speaking: eccentricity ratio and shaft position should be an integral part of the transient vibration analysis process Transient Vibration Analysis / Vibration Institute Meeting Halifax, NC 07-Dec-2007
Waterfall & Cascade Plots • Waterfall and cascade plots are three-dimensional graphs of spectra at various machine speeds and times. They allow us to see the entire frequency content from a location as a function of speed. Transient Vibration Analysis / Vibration Institute Meeting Halifax, NC 07-Dec-2007
Diagonal relationships 1X 2X 3X Waterfall & Cascade Plots • Orders of running speed (1X, 2X, 3X, etc.) form near-diagonal lines in the plot Transient Vibration Analysis / Vibration Institute Meeting Halifax, NC 07-Dec-2007
Vertical relationships Horizontal relationships 1X 2X 3X Waterfall & Cascade Plots • Horizontal relationships can be analyzed for resonance, looseness, rubs, instability, etc. • Vertical relationships onset and progress of resonant related activity, and any constant-frequency vibration that may be present. Transient Vibration Analysis / Vibration Institute Meeting Halifax, NC 07-Dec-2007
Waterfall & Cascade Plots • Vertical relationships may be due to: • Adjacent machinery – check their speeds against your data • Ground faults or electrical noise in your instrumentation – the peaks will line up vertically at 60 Hz (3600 cpm) • Structural resonances will get easily excited by orders of running speed as machine speed increases or decreases • Oil Whirl: look for subsynchronous vibration at 0.4X – 0.48X that tracks running speed • Oil Whip: look for subsynchronous vibration in the at a frequency equal to the rotor’s 1st lateral balance resonance • Anisotropic shaft stiffness due to cracking or by design – look for excitation of the 2X order line at ½ the balance resonance Transient Vibration Analysis / Vibration Institute Meeting Halifax, NC 07-Dec-2007
Conclusion This presentation was compiled from the author’s paper,“Transient Vibration Analysis, Insights into Machinery Behavior,”presented 07-Dec-2007 at the Vibration Institute’s Piedmont Chapter meeting in Halifax, NC. For a copy of that paper, please contact the author: Stanley R. Bognatz, P.E. President & Principal Engineer M&B Engineered Solutions, Inc. 75 Laurel Street Carbondale, PA 18407 Tel. (570) 282-4947 Cell (570) 575-9252 Email: srb@mbesi.com Transient Vibration Analysis / Vibration Institute Meeting Halifax, NC 07-Dec-2007
Thank You – Any Questions? Transient Vibration Analysis / Vibration Institute Meeting Halifax, NC 07-Dec-2007