Download

1 / 32
320 likes | 844 Vues
Root Causes of Social Vulnerability: Demographic and Economic Trends Session 6. Session Objectives. Understand major demographic trends in the U.S. and globally. Understand broad migration trends in the U.S. and globally. Explore poverty in the U.S. and globally.

E N D
Root Causes of Social Vulnerability: Demographic and Economic Trends Session 6
Session Objectives • Understand major demographic trends in the U.S. and globally. • Understand broad migration trends in the U.S. and globally. • Explore poverty in the U.S. and globally. • Appreciate how population trends can contribute to vulnerability and require special consideration for emergency management and disaster response. Later sessions will explore the relationship between these trends and vulnerability in more detail.
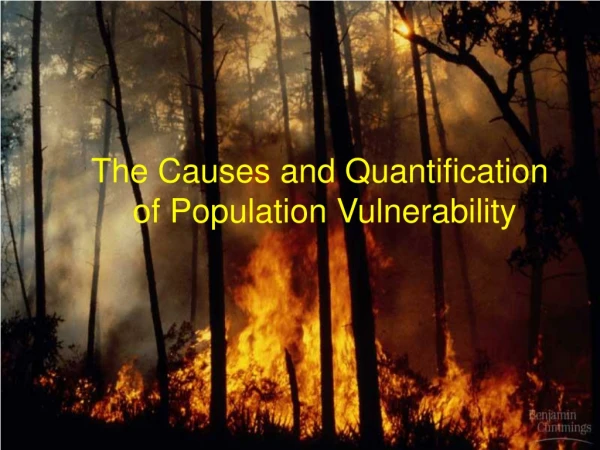
Population growth Land pressure Urbanization Inequality Climate change Political change Economic growth Technological innovation Social expectations Global interdependence Why disaster losses go up…
Population & Economic Trends • General trends contributing to vulnerability • Population trends • Population increase • Children & Elderly • Diversity • Migration • Economic disparity • Poverty • Access to resources
Population Growth • Birth Rates: annual # of live births/1000 people • Fertility Rates: annual average number of children a woman has during reproductive years • Death Rates = annual mortality rate/1000 • Natural increase = Birth Rate – Death Rate
Implications of Population Growth • Carrying Capacity • Maximum # of individuals of any species that can be supported by a particular ecosystem on a long-term basis • Different views: • Zero Population Growth: Ehrlich (1970) • Bring ‘em on!: Boserup (1965) • Creating stress on resource and land use • Living in more marginal environments, particularly with regard to hazards • Changing demographic structure, altering vulnerabilities
Population in billions 10 2000 6.1 billion 8 6 4 2 1750 1800 1850 1900 1950 2000 2050 2100 2150 Source: United Nations, World Population Prospects, The 1998 Revision; and estimates by the Population Reference Bureau.
Population by Age and Sex: 1990, and 2030 Developing Countries Developed Countries
U.S. Child and Old-Age Dependency Ratios, 1900–2000, Projections to 2050
Migration Implications for Vulnerability • Changing nature of communities • Social and family networks change • Shifting resources • As people move to new places • Often do not have understanding of hazards in new location • Past experiences do not necessarily correspond to changed geography • Limited knowledge about resources & hazards
Factors Influencing Why People Migrate • Push factors • Pull factors • Ease of movement • Alternative destinations • Perception/Information
Migration Trends • Numbers • About 175 million people, or 3% of world’s population • 60% reside in developed nations • Refugee populations • 15.9 million people in 2000 • Most are in developing nations (12.9 million) • Urbanization • In U.S., toward the coast
Countries with the Largest International Migrant Stock, 2000 Source: United Nations, Population Division, Department of Economic and Social Affairs, International Migration, 2002.
Urbanizing Population Percent of Population Living in Urban Areas, 1950, 1975, 2000, & 2025 Share of World Population Growth in Urban & Rural Areas, 1950-2025 Source: United Nations, World Urbanization Prospects: The 1999 Revision (2000).
Percent Urban 5-28 29-44 45-61 62-79 80-100 Urbanizing Population Source: derived from 2002 World Population Data Sheet of the Population Reference Bureau
Reasons for Moving in the U.S.,1999-2000 • Family (26.3%) • Change in marital status • To establish own household • Other * • Work (16.2%) • New job/job transfer * • To look for work/lost job • Closer to work/easier commute • Retired • Housing (51.6%) • Wanted to own home/not rent • New/better house/apartment * • Better neighborhood/less crime • Cheaper housing • Other (6.0%) • attend/leave college * • Change of climate • Health reasons Source: U.S. Census Bureau, Current Population Survey, March 1998, March 1999, and March 2000.
Net International and Interstate Migration by State, 2000–2001
Poverty and Vulnerability • Direct link between poverty and vulnerability • Affects access to monetary resources in face of disaster • Impacts ability to mitigate against hazards • Must prioritize everyday needs
Income Disparities • Almost one-quarter of the world's 5.7 billion people ''continues to live in a state of severe poverty.'' United Nations • More than 1.3 billion people currently live below the poverty line, surviving on a dollar a day • 41 countries designated as "heavily indebted poor countries" by the World Bank, 39 fall into the category of high-fertility nations, where women, on average, bear four or more children. (August 2002)
UNDP Poverty Report 2000 • Two ways of measuring poverty • The $1 per day is an income measure of poverty: it measures the percentage of people who live on less than $1 per day • The Human Poverty Index (HPI)
UNDP Poverty Report 2000 • The HPI measures deprivation in basic human development. It takes into account: • % of people expected to die before age 40 • % of adults who are illiterate • % of population without access to health services • % of population without access to safe water • % of children under five who are underweight
UNDP Poverty Report 2000 Population living on less than US$1 Per Day (percent)
UNDP Poverty Report 2000 Human Poverty Index for Developing Countries
Life Expectancy at Birth: 2000 Under 50 years 50 to 64 years 65 to 74 years 75 years and over Source: derived from 2002 World Population Data Sheet of the Population Reference Bureau
Median Income for Households Average Income per Household By Race & Hispanic Origin Of Householder: 1999 Economic Disparity in U.S.
Percent of U.S. Children in Poverty, 2000 Source: U.S. Census Bureau. Data from the March 2000 Current Population Study, available at www.census.gov and http://ferret.bls.census.gov.
U.S. Home Ownership, 2000 • 72 percent of non-Hispanic whites • 53 percent of Asians • 46 percent of African Americans and of Hispanics. • Gap narrowed in recent decades, due in part to an increasing number of mortgage loans to low-income, minority households
Population, Economics and Vulnerability • Only a subset of indicators shown here • Many will be explored in greater detail in following sessions • BOTTOM LINE… hazards impact groups of people differentially based on demographics and wealth How do we correct this?