Download
1 / 63
630 likes | 723 Vues
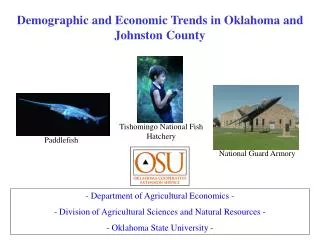
Tishomingo National Fish Hatchery. Demographic and Economic Trends in Oklahoma and Johnston County. Paddlefish. National Guard Armory. - Department of Agricultural Economics - - Division of Agricultural Sciences and Natural Resources - - Oklahoma State University -. By:.

E N D
Tishomingo National Fish Hatchery Demographic and Economic Trends in Oklahoma and Johnston County Paddlefish National Guard Armory - Department of Agricultural Economics - - Division of Agricultural Sciences and Natural Resources - - Oklahoma State University -
By: Suzette Barta, Asst. Extension Economist OSU, Stillwater Susan Trzebiatowski, Student Assistant OSU, Stillwater Jack Frye, Community Development Specialist OSU, Ada Virginia McCarthick, County Extension Director OSU, Tishomingo Mike Woods, Extension Economist OSU, Stillwater
Part IRural Development in Oklahoma What are the issues?
Population Loss • Oklahoma’s population increased by 9.7% from 1990-2000, according to the Census Bureau. • The US population increased by about 13.2%. • As a result, Oklahoma’s number of Representatives to the House decreased from 6 to 5. OK Loses a Rep.
Employment Opportunities If I could change one thing about my community, it would be: “…better paying jobs and more of them.” Pushmataha County Community Survey, AE-02024, March 2002 Old Frisco Depot in Antlers
Low Income • Why does Per Capita Income in Oklahoma lag the rest of the nation? Some possibilities: • Low Educational Attainment • Cost of Living • Cultural Attitudes • Different Occupational Mix than U.S. • Inadequate Transportation Systems Oklahoma League of Economists, Spring 1999 Policy Survey of Members
Population Trends... • Across the United States, population growth in the “bread basket” states is slow relative to the rest of the country. • In Oklahoma, the fastest growing counties are those in the central and eastern portions of the state--often bordering Tulsa and Oklahoma Counties. • Western counties in Oklahoma are losing population. • In general, non-metro counties are losing population relative to metro counties. ...In Oklahoma and Nationwide
58.5% Percent of Population Living in Non-Metropolitan Areas for Each State 16.9% 37.6% 67.3% 66.1% 55.7% 59.7% 26.8% 29.5% 60.6% 65.3% 32.1% 7.9% 1.5% 70% 17.8% 15.4% 8.6% 8.2% 54.6% 47.3% 27.8% 13.4% 0% 18.8% 23.5% 15.1% 57.6% 3.3% 16.1% 20% 43.3% 32.2% 21.8% 51.2% 7.3% 32.4% 32.1% 39.2% 11.7% 43% 51% 30% 27.8% 63.9% 30.7% 30.1% 15.1% 0%-14% Non-metro Population 24.6% 15%-25% Non-metro Population 7.1%5 26%-50% Non-metro Population 51% or more Non-metro Population Source: Bureau of Economic Analysis for 1999.
Population: Metro vs. Non-Metro 3,025,487 3,145,576 3,450,654 57% 59% 61%
Population Density for Oklahoma Counties Population per Square Mile (2000) CIMARRON TEXAS BEAVER HARPER OTTAWA NOWATA GRANT KAY ALFALFA WOODS WASHINGTON CRAIG OSAGE WOODWARD NOBLE DELAWARE ROGERS ELLIS MAJOR GARFIELD MAYES PAWNEE TULSA PAYNE DEWEY CREEK WAGONER BLAINE CHEROKEE LOGAN KINGFISHER ROGER MILLS ADAIR MUSKOGEE Over 930 OKLAHOMA LINCOLN CUSTER OKMULGEE SEQUOYAH CANADIAN OKFUSKEE 100-388 McINTOSH BECKHAM WASHITA HASKELL POTTA- CLEVELAND HUGHES CADDO 50-99 WATOMIE SEMINOLE GRADY PITTSBURG GREER KIOW A LATIMER 10-49 MCCLAIN LE FLORE PONTOTOC HARMON GARVIN Less than 10 COMANCHE JACKSON COAL STEPHENS PUSHMATAHA TILLMAN MURRAY COTTON ATOKA JOHNSTON CARTER JEFFERSON CHOCTAW MCCURTAIN MAR- LOVE SHALL BRYAN Average for the state of Oklahoma = 50.2
CIMARRON TEXAS BEAVER HARPER OTTAWA NOWATA GRANT KAY ALFALFA WOODS WASHINGTON CRAIG OSAGE WOODWARD NOBLE DELAWARE ROGERS ELLIS MAJOR GARFIELD MAYES PAWNEE TULSA PAYNE DEWEY CREEK WAGONER BLAINE CHEROKEE LOGAN KINGFISHER ROGER MILLS ADAIR MUSKOGEE OKLAHOMA LINCOLN CUSTER OKMULGEE SEQUOYAH CANADIAN OKFUSKEE McINTOSH CLEVELAND BECKHAM WASHITA HASKELL POTTA- HUGHES CADDO WATOMIE SEMINOLE GRADY PITTSBURG GREER KIOW A LATIMER MCCLAIN LE FLORE PONTOTOC HARMON GARVIN COMANCHE JACKSON Above State Average COAL STEPHENS PUSHMATAHA TILLMAN MURRAY COTTON Equal to State Average ATOKA JOHNSTON CARTER JEFFERSON CHOCTAW MCCURTAIN MAR- LOVE Below State Average SHALL BRYAN State Average: 25.9% Percent of Total Population Under 18 Years Source: U.S. Census Bureau
CIMARRON TEXAS BEAVER HARPER OTTAWA NOWATA GRANT KAY ALFALFA WOODS WASHINGTON CRAIG OSAGE WOODWARD NOBLE DELAWARE ROGERS ELLIS MAJOR GARFIELD MAYES PAWNEE TULSA PAYNE DEWEY CREEK WAGONER BLAINE CHEROKEE LOGAN KINGFISHER ROGER MILLS ADAIR MUSKOGEE OKLAHOMA LINCOLN CUSTER OKMULGEE SEQUOYAH CANADIAN OKFUSKEE McINTOSH CLEVELAND BECKHAM WASHITA HASKELL POTTA- HUGHES CADDO WATOMIE SEMINOLE GRADY PITTSBURG GREER KIOW A LATIMER MCCLAIN LE FLORE PONTOTOC HARMON GARVIN COMANCHE JACKSON COAL STEPHENS PUSHMATAHA TILLMAN MURRAY COTTON Above State Average ATOKA JOHNSTON CARTER JEFFERSON CHOCTAW MCCURTAIN MAR- LOVE Below State Average SHALL BRYAN State Average: 13.2% Percent of Total Population Over 65 Years Source: U.S. Census Bureau
Employment Trends... • Employment growth has been greatest in the eastern half of the state. • Western counties are losing jobs relative to eastern counties. • Unemployment rates are higher in non-metropolitan counties. ...In Oklahoma
Percentage Employment Growth 1990-2000 CIMARRON TEXAS BEAVER HARPER OTTAWA NOWATA GRANT KAY ALFALFA WOODS WASHINGTON CRAIG OSAGE WOODWARD NOBLE DELAWARE ROGERS ELLIS MAJOR GARFIELD MAYES PAWNEE TULSA PAYNE DEWEY CREEK WAGONER BLAINE CHEROKEE LOGAN KINGFISHER ROGER MILLS ADAIR MUSKOGEE OKLAHOMA LINCOLN Over 22% Growth CUSTER OKMULGEE SEQUOYAH CANADIAN OKFUSKEE 10%-22% Growth McINTOSH CLEVELAND BECKHAM WASHITA HASKELL POTTA- HUGHES CADDO WATOMIE SEMINOLE 0 to 10% Growth GRADY PITTSBURG GREER KIOW A LATIMER MCCLAIN Negative Growth LE FLORE PONTOTOC HARMON GARVIN COMANCHE JACKSON COAL STEPHENS PUSHMATAHA TILLMAN MURRAY COTTON ATOKA JOHNSTON CARTER JEFFERSON CHOCTAW MCCURTAIN MAR- LOVE SHALL BRYAN Shades of purple indicate growth that is slower than the state’s growth of 22%.
Oklahoma Unemployment Rates, 1990-2001, State, Metro & Non-Metro Areas
Employment Growth in Metro and Non-metro Oklahoma, 1995-2000 Source: Regional Economic Information System, BEA
Manufacturing Employment for Non-metropolitan Areas in Oklahoma, 1980-2000 Source: Regional Economic Information System, Bureau of Economic Analysis
Manufacturing Employment as a Percent of Total Employment for Oklahoma Counties, 1999 CIMARRON TEXAS BEAVER HARPER OTTAWA NOWATA GRANT KAY ALFALFA WOODS WASHINGTON CRAIG OSAGE WOODWARD NOBLE DELAWARE ROGERS ELLIS MAJOR GARFIELD MAYES PAWNEE TULSA PAYNE DEWEY CREEK WAGONER BLAINE CHEROKEE LOGAN KINGFISHER ROGER MILLS ADAIR MUSKOGEE OKLAHOMA LINCOLN Greater than 20% CUSTER OKMULGEE SEQUOYAH CANADIAN OKFUSKEE 15.1% to 20% McINTOSH CLEVELAND BECKHAM WASHITA HASKELL POTTA- HUGHES CADDO WATOMIE SEMINOLE 9.63% to +15% GRADY PITTSBURG GREER KIOW A LATIMER MCCLAIN Less than 9.63% LE FLORE PONTOTOC HARMON GARVIN COMANCHE JACKSON COAL STEPHENS PUSHMATAHA TILLMAN MURRAY State percent is 9.63%. COTTON ATOKA JOHNSTON CARTER JEFFERSON CHOCTAW MCCURTAIN MAR- LOVE SHALL BRYAN U.S. percent is 11.76%
1999 County Trade Pull Factors CIMARRON TEXAS BEAVER HARPER OTTAWA NOWATA GRANT KAY ALFALFA WOODS WASHINGTON CRAIG OSAGE WOODWARD NOBLE DELAWARE ROGERS ELLIS MAJOR GARFIELD MAYES PAWNEE Greater than 1.0 TULSA PAYNE DEWEY CREEK WAGONER BLAINE CHEROKEE LOGAN 0.75 - 0.99 KINGFISHER ROGER MILLS ADAIR MUSKOGEE OKLAHOMA LINCOLN CUSTER OKMULGEE 0.50 – 0.74 SEQUOYAH CANADIAN OKFUSKEE McINTOSH 0.25 – 0.49 BECKHAM WASHITA HASKELL CLEVELAND POTTA- HUGHES CADDO WATOMIE SEMINOLE GRADY Less than 0.25 PITTSBURG GREER KIOW A LATIMER MCCLAIN LE FLORE PONTOTOC HARMON GARVIN COMANCHE JACKSON COAL STEPHENS PUSHMATAHA TILLMAN MURRAY COTTON ATOKA JOHNSTON CARTER JEFFERSON CHOCTAW MCCURTAIN MAR- LOVE SHALL BRYAN Source: Oklahoma Business Bulletin, October 2000
Income Trends... • Oklahoma per capita income falls behind most of our surrounding states. • Non-metro PCI in Oklahoma lags metro PCI. • Although all counties show some growth in income, Central Oklahoma and the far eastern counties show the fastest growth in total personal income. ...In Oklahoma
Total Personal Income Percentage Growth,1990-2000. CIMARRON TEXAS BEAVER HARPER OTTAWA NOWATA GRANT KAY ALFALFA WOODS WASHINGTON CRAIG OSAGE WOODWARD NOBLE DELAWARE ROGERS ELLIS MAJOR GARFIELD MAYES PAWNEE TULSA PAYNE DEWEY CREEK WAGONER BLAINE CHEROKEE LOGAN KINGFISHER ROGER MILLS ADAIR MUSKOGEE OKLAHOMA LINCOLN Greater than 60% CUSTER OKMULGEE SEQUOYAH CANADIAN OKFUSKEE 41%-60% McINTOSH CLEVELAND BECKHAM WASHITA HASKELL POTTA- HUGHES CADDO WATOMIE SEMINOLE 21%-40% GRADY PITTSBURG GREER KIOW A LATIMER MCCLAIN 0-20% LE FLORE PONTOTOC HARMON GARVIN COMANCHE JACKSON COAL STEPHENS PUSHMATAHA TILLMAN MURRAY COTTON ATOKA JOHNSTON CARTER JEFFERSON CHOCTAW MCCURTAIN MAR- LOVE SHALL BRYAN Shades of green indicate growth that is slower than the state’s rate of growth of 60%.
Per Capita Income for Oklahoma and Surrounding States: 1990-2000 OK-Metro OK OK-Nonmetro Source: Regional Economic Information System, BEA
Average Wage per Job, 1999 Source: Bureau of Economic Analysis
Top Ten Counties with Greatest Percent of Total Personal Income from Farm Earnings, 2000 CIMARRON TEXAS BEAVER HARPER OTTAWA NOWATA GRANT KAY ALFALFA WOODS WASHINGTON CRAIG OSAGE WOODWARD NOBLE DELAWARE ROGERS ELLIS MAJOR GARFIELD MAYES PAWNEE TULSA PAYNE DEWEY CREEK WAGONER BLAINE CHEROKEE LOGAN KINGFISHER ROGER MILLS ADAIR MUSKOGEE OKLAHOMA LINCOLN CUSTER OKMULGEE SEQUOYAH CANADIAN OKFUSKEE McINTOSH CLEVELAND BECKHAM WASHITA HASKELL POTTA- HUGHES CADDO WATOMIE SEMINOLE GRADY PITTSBURG GREER KIOW A LATIMER MCCLAIN LE FLORE PONTOTOC HARMON GARVIN COMANCHE JACKSON COAL STEPHENS PUSHMATAHA TILLMAN MURRAY COTTON ATOKA JOHNSTON CARTER JEFFERSON CHOCTAW MCCURTAIN MAR- LOVE SHALL BRYAN
Average Annual Employment and Per Capita Income Growth by County 1990-2000: Relative to U.S. Average. CIMARRON TEXAS BEAVER HARPER OTTAWA NOWATA GRANT KAY ALFALFA WOODS WASHINGTON CRAIG OSAGE WOODWARD NOBLE DELAWARE ROGERS ELLIS MAJOR GARFIELD MAYES PAWNEE TULSA PAYNE DEWEY CREEK WAGONER BLAINE CHEROKEE LOGAN KINGFISHER Employment growth and per capita income growth greater than US average. ROGER MILLS ADAIR MUSKOGEE OKLAHOMA LINCOLN CUSTER OKMULGEE SEQUOYAH CANADIAN OKFUSKEE McINTOSH Employment growth greater than US average. Per capita income growth less than US average. CLEVELAND BECKHAM WASHITA HASKELL POTTA- HUGHES CADDO WATOMIE SEMINOLE GRADY PITTSBURG GREER KIOW A LATIMER MCCLAIN LE FLORE Employment growth less than US average. Per capita income growth greater than US average. PONTOTOC HARMON GARVIN COMANCHE JACKSON COAL STEPHENS PUSHMATAHA TILLMAN MURRAY Employment growth and per capita income growth less than US average. COTTON ATOKA JOHNSTON CARTER JEFFERSON CHOCTAW MCCURTAIN MAR- LOVE SHALL BRYAN PCI Average Annual Growth Rate for the US =5.06% Employment Average Annual Growth Rate for the US= 2.01%
Part II. A Summary of Economic Conditions in Johnston County Bank of the Chickasaw Nation Blue River Murray State College
Population of Johnston County, Oklahoma, 1980-2000 Source: U.S. Census Bureau
Population, Housing Units, and Average Household Size for Johnston County, Oklahoma 2000 Avg. Household Size for Oklahoma: 2.49 Source: U.S. Census Bureau
Percent of Total Housing Units in Johnston County, 2000 Total Housing Units in Johnston County – 4,782 Source: U.S. Census Bureau
Johnston County Population for Age Groups 65 & Over and Under Age 19, 1990-2000 Source: Woods and Poole, 2002
Percent of Total Enrollment in Johnston County, Oklahoma, 2000 Total Enrollment for Johnston County – 2,768 Source: U.S. Census Bureau
Percent of Education Attained in Johnston County for Persons Age 25 and Over, 2000 Total persons 25 years and over in Johnston County –6,759 Source: U.S. Census Bureau
Percent of Education Attained in Oklahoma for Persons Age 25 and Over, 2000 Total persons 25 years and over in Oklahoma – 2,203,173 Source: U.S. Census Bureau
Total Employment for Johnston County, OK, 1990-2002 Source: Oklahoma Employment Security Commission
Unemployment Rates for Johnston County and Oklahoma, 1990-2002 Source: Oklahoma Employment Security Commission
Per Capita Income for Johnston County and Oklahoma Source: Regional Economic Information System, Bureau of Economic Analysis
Transfer Payments by Type for Johnston County, Oklahoma, 1990-2000 Source: Regional Economic Information System, Bureau of Economic Analysis
Sales Subject to Sales Tax for Johnston County 1992-2002 Source: ORIGINS
Total Farm Labor and Proprietors’ Income for Johnston, Oklahoma
Selected Farm Characteristics of Johnston County, Oklahoma, 1997 Source: 1997 Census of Agriculture
Part III. Retail Trade Analysis for Communities in Johnston County Bell at Chickasaw Capitol Bldg Tishomingo Fish Hatchery Prepared by the Oklahoma Cooperative Extension Service
Population for Tishomingo and Other Towns in Johnston County1980-2000
Sales Tax Collectionsfor Tishomingo, OK, 1980-2002 2% 1%-3% 1%-3%