Download
1 / 4
40 likes | 185 Vues
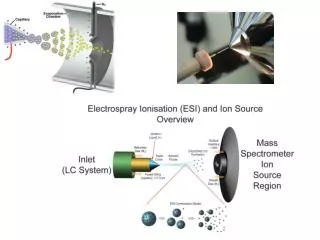
This study utilizes the UltrafleXtreme MALDI-TOF/TOF mass spectrometer equipped with a 355nm, 1000Hz Nd:YAG laser to analyze oil extraction from source rock samples. The accelerating voltage was set to 25kV with a detector voltage of 2.6kV, and spectra were obtained from 200 to 1000 laser shots. We detail the differences between hydrous pyrolysis and in situ simulator methods for oil extraction. Both methods heat samples to 360°C, but vary in oil collection and heating rates. Supplementary figures showcase various mass spectra for further analysis.

E N D
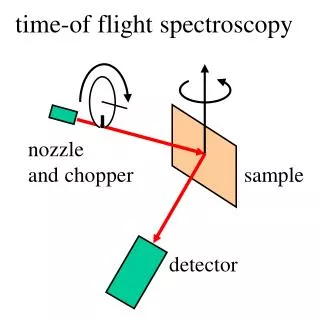
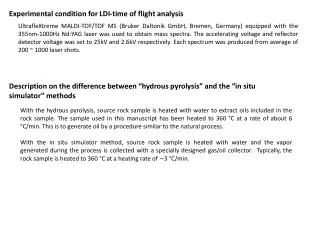
Experimental condition for LDI-time of flight analysis UltrafleXtreme MALDI-TOF/TOF MS (BrukerDaltonik GmbH, Bremen, Germany) equipped with the 355nm-1000Hz Nd:YAG laser was used to obtain mass spectra. The accelerating voltage and reflector detector voltage was set to 25kV and 2.6kV respectively. Each spectrum was produced from average of 200 ~ 1000 laser shots. Description on the difference between “hydrous pyrolysis” and the “in situ simulator” methods With the hydrous pyrolysis, source rock sample is heated with water to extract oils included in the rock sample. The sample used in this manuscript has been heated to 360 °C at a rate of about 6 °C/min. This is to generate oil by a procedure similar to the natural process. With the in situ simulator method, source rock sample is heated with water and the vapor generated during the process is collected with a specially designed gas/oil collector. Typically, the rock sample is heated to 360 °C at a heating rate of ∼3 °C/min.
Figure 1S. Graph showing relative surface area of NPG surfaces normalized with respect to the flat Au surface as a function of deposition charges.
Figure 2S. LDI-MS spectra of veraparamil (MW = 454.60) loaded on (a) NPG #1, (b) NPG #2, and (c) NPG #5. 4 (a) x10 455.3 1.5 1.0 0.5 0.0 4 (b) x10 1.5 455.5 1.0 Intens. [a.u.] 0.5 0.0 4 (c) x10 1.5 1.0 455.5 0.5 0.0 200 300 400 500 600 m/z
Figure 3S. LDI-MS spectra of the shale oil extract deposited on (a) NPG target #1 (b) NPG target #3 and (c) NPG target #5. (b) (a) (c)