Understanding Six Sigma: Process Capability and Improvement Methodology
Six Sigma is both a statistical measurement of process capability and a structured approach to process improvement. It predicts a long-term defect rate of 3.4 defects per million opportunities (DPMO) and follows the DMAIC methodology—Define, Measure, Analyze, Improve, Control. Six Sigma can be expressed at two levels: CTQ (Critical to Quality) and overall process. A Six Sigma process typically has six standard deviations between the mean and the nearest specification limit, accounting for mean shifts over time. Understanding short-term versus long-term data is crucial for maintaining Six Sigma standards.

Understanding Six Sigma: Process Capability and Improvement Methodology
E N D
Presentation Transcript
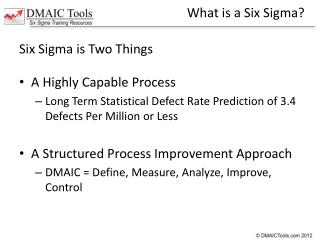
What is a Six Sigma? Six Sigma is Two Things • A Highly Capable Process • Long Term Statistical Defect Rate Prediction of 3.4 Defects Per Million or Less • A Structured Process Improvement Approach • DMAIC = Define, Measure, Analyze, Improve, Control
Six Sigma Process Capability Six Sigma Capability Can be Expressed at Two Levels • At the CTQ Level “The new press has Six Sigma capability on the 2.5mm +/- .05mm press dimension.” • At the Overall Process Level “The fuel pump assembly line is a Six Sigma process.” - Methods vary for calculating total process capability, like DPMO or RTY
Six Sigma Process Capability • A Six Sigma Process Has at Least Six Standard Deviations Between the Mean and the Nearest Spec Limit Nearest Specification Limit Short-Term Measurement Data on the CTQ, i.e. “press dimension XYZ” Mean When dealing with short-term data, this 1.5σ “buffer” is reserved for future mean-shift. 6σ Minimum Distance σ σ -2 σ 2 σ σ σ -3 3 -1 1 0
Six Sigma Accounts for Mean Shift Data at Time of Project Closure • Six Sigma assumes that the mean will shift by as much as 1.5σ in either direction over the long run • If long term data is being used, then the 6σ requirement drops to 4.5σ, since the mean shift is already present in the data Worst-Case Future Mean Shift to Right Worst-Case Future Mean Shift to Left Nearest Specification Limit σ σ -2 σ 2 σ σ σ -3 3 -1 1 0
Process Variation Over Time Upper Spec Limit Multiple Samples Combined Over the Long Run = Long Term Data C T Q Data Sample at a Point in Time = Short Term Data Lower Spec Limit Time
Process Variation Over Time Upper Spec Limit Multiple Samples Combined Over the Long Run = Long Term Data Mean Shift C T Q Data Sample at a Point in Time = Short Term Data Lower Spec Limit Time
Long Term Versus Short Term Data 6σSHORT TERM = 4.5σLONGTERM • A process that is 6σ capable in the short term is assumed to drift by as much as 1.5σ over the long run, so the capability will deteriorate to 4.5σ – this is where the 3.4 PPM long term defect rate comes from. • In the vast majority of cases, data collected is assumed to be short term. • At the end of a Six Sigma project, sufficient time has not passed to consider the data long term.