Download
1 / 26
260 likes | 281 Vues
This report provides an overview of the final construction phase of the Timing Counter (TC), including the gluing of Fiber APDs and the coating of the TC with high reflectance polymer foil. It also discusses the positioning of the TC in COBRA, as well as the timing analysis and evaluation of timing resolutions. The report concludes with preliminary results and further areas for assessment.

E N D
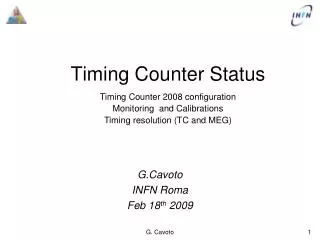
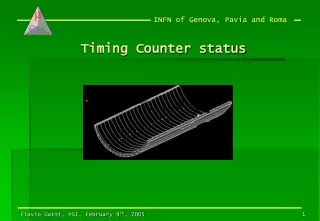
Timing Counter Report of Feb 20th, 2008 F.Gatti
Final Construction Phase of TC TC with fibers exposed TC upside down for Fiber APD gluing High reflectance polymer foil coating TC before insertion in COBRA Cables and pipes of TC in COBRA before final positioning
COBRA BORE +15 mm from nominal position TC TC/Bag final positioning DCH supports Bag SS inner cap COBA inner step Bag SS inner edge Bag EVAL inner side backside illuminated PM at the final position inside bag
Fibers detector • Fibers detector “turned on” • The analog output achieved a good S/N level that has been tested channel by channel. • A selected event of a CR that hits at least 3 fibers is shown as example 8 Channels analog sum 8 Channels analog sum 8 Channels analog sum Signal of 8+8 Interleaved fibers
e+ A A C B Timing Analysis • Use positrons runs with TRIGGER on TC only (2 or 3 contiguous bars in coincidence). • Reference data: 250k triggers belonging to #8378-#8408 runs • Measure bar average time Tk • First method: s (Tk-Tk+1) ≈ s (s/c+dT) • Second method: s (Tk+Tk+2 )/2 - Tk+1≈ s (0+DT) s
No cuts timing analysis: 3 bars example Correction for the first two bars used Higher order effects
No cuts timing analysis: all bars Different chip downstream upstream Bar2–Bar1 Bar1–Bar0
Searching the intrinsec timing resolutions • The methods give z-dependent results low z cuts give better resolution not fully explained by MC and presently under study • Time reconstruction from digitized pulse are affected by the electronics/algorithm intrinsic jitter evaluation of this time jitter has been done in a dedicated run. • Double Threshold Discriminator pulse is available to overcome the elctr./alg. jitter
Z-cuts Timing Analysis with DTD and PMT pulses • Cuts: 0.1V<pulse height<0.3V (Landau peak) • Reconstructed z on first bar < 55 cm DTD Time resolution s = 52 ps DTD Bar3 - Bar2 Bar3 - Bar2 PMT Bar3 - Bar2 PMT Time resolution s = 62 ps
Runs 9337-9344 Intrinsic electronics/algorithm jitter in PMT signal • Dedicated positron runs: one PM signal feeds the two input channels of the corresponding bar: • same signal to the two electronics chains of the bar. • Time distribution only affected by electronics/algorithm jitter • It has been measured • s(T1-T2)= 2 s ((T1+T2/2)) • Average jitter value= 54 ps • Final PMT timing resolution after elect/algor. jitter subtraction 55 ps rms 129 ps FWHM • DTD analysis gives 120 ps FWM without jitter correction. • Latest preliminary results on DTD after jitter correction: 108 ps FWHM Runs9362-9363
First comments on time analysis • DTD pulse analysis method shows better performance in the first analysis (not all correction applied as in PMT signal analysis). • PMT and DTD give us good redundancy for the timing of a single event. • Corrections for the time-walk, hit position, electr./algorithm jitter, systematic of the timing resolution analysis methods, are under study. • Z dependence of T resolution under study (MC vs data comparison): the effect suggests a dependence of the chosen timing method on track inclination (low Z low impulse z projection). • Finally the TC intrinsic time resolution in operating conditions is now evaluated to be 120 ps FWMH (20% excess respect to the proposal), • Latest preliminary results show 108 ps FWHM jitter corrected DTD signal. • We are confident that there is room for the fine tuning of the timing analysis and a further assessment of the of the timing resolution
Black: CR run Red: B run Green: LiF run PMT equalization ( CR and CW data)
Charge Analysis • Veff: • measurement of positron impact time on the bar, T • measurement of z can be made, in principle, from the width of the t1-t0distribution • Measurement of z with the charge, once that eff is known • need (veff)/veff~1% to achieve the desired T resolution • eff: • independent measurement of z can be measured from: • - ln(Q1/Q0) vs z determined with time once that veff is known • - ln(Q1/Q0) using z measurement from fibers
Significant differences among bars, consistent with results at BTF. Data suggests not uniform losses in the internal reflection: - residual surface roughness (measured value lower than 0.2 mm RA) - plastic enclosure residual reflectivity Effective velocity: 14.5+/-0.2 cm/n Black: CR run Red: B run Green: LiF run l eff. and Veff. l eff
256 nm 50Hz @ 532nm 50 Hz Acustic-optical pulse selectors 2 stages pulse amplifier 3m cavity 48 MHz, 1064nm Diode pumped Nd:YVO Laser for 532 and 266 nm monitoring pulse • The system delivered during the run. Now under test with the optical fiber distributor • Power stability at 48 MHz, 1064 nm, within 0.3% over a week of monitoring • Timing pulse distributed via optical fiber and detected on TC DS at 50 Hz free running repetition rate To opt. fiber and fast APD for trig. Out. To fast APD for power and int.pulse sync
Laser Status • Laser assembly and table under integration before transportation at PSI
Preparation for the run08 • Completion of the commissioning of the digital hit map for the fibers with CR (Mostly done last week) • Works on TC: change of PMTs with unexplained low gain, close light leak in the APD fibers detector, change not working APD boards, improve S/N and noise immunity of the APD analog output • Improvement of the S/N will allow to decrease the threshold level in trigger algorithm recover some delay (20-30 ns ?) in the trigger latency • Rebuild N2 Bags • Integrate the Laser for TC and XEC
Question of shaping time of APD electronics • The 160 ns shaping time (10-90%) + the latency of the trigger APD algorithm prevented the use of the in the on line trigger selection in the run07 • An anticipation of about 60 ns of the formed trigger signal from APD should be enough ton solve the problem • Improvement of the S/N will allow to decrease the threshold recover some delay (20-30 ns?) • From the trigger side it is possible to reduce the processing time of the algorithm. • APD online in the trigger for Run08 • Alternative possibility of reducing shaping time for 512 channels is not a trivial task and requires 7 weeks of with 6 people. This could be done eventually at the end of the run 08
Last on PMT life • The measurement lasted 290 days for a total current of 2130 Coulomb on a new PMT • The average current produced by the PMT over the period has been 88,2 microA • Data presented has been already corrected by the laser power variation with the photocell values
Previous measurements on old PM Drift region of the old 1-1/2” PM 1 3 2 5
New measurements: 6.6 x life without changes 1 2 3 4 5 6
backup DT-data DT-MC
s/2 A C B Backup • T1= t0 + x/c • T2= t0 + (L-x)/c • T1+T2= 2 t0 + L/c • TA=(T1+T2)/2= t0 + L/2c • TB=t0+s/c+ L/2c • TA-TB = s/c s/2 • TA+TB=2t0+s/c+(L/c) • TC=t0+s/2c+L/2c • (TA+TB)/2-TC= t0+s/2c+L/2c-t0-s/2c+L/2c=0