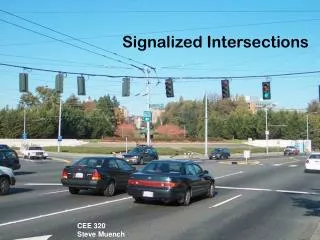
Signalized Intersections
Signalized Intersections. Darcy Bullock, Ed Smaglik Anuj Sharma, Tim Wells. Signalized Intersection Chapters. Chapter 10: Concepts Chapter 15: Urban Arterials Chapter 16: Intersection Analysis Course will emphasize Chapter 16, draw on material from Chapter 10, and conclude with Chapter 15.

Signalized Intersections
E N D
Presentation Transcript
Signalized Intersections Darcy Bullock, Ed SmaglikAnuj Sharma, Tim Wells
Signalized Intersection Chapters • Chapter 10: Concepts • Chapter 15: Urban Arterials • Chapter 16: Intersection Analysis • Course will emphasize Chapter 16, draw on material from Chapter 10, and conclude with Chapter 15
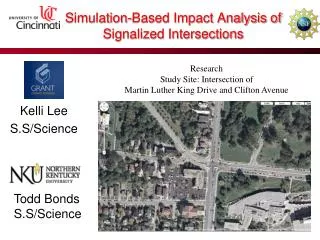
Session Format • Work in Detail a Chapter 16 analysis of an intersection loosely modeled on SR 26 at Creasy in Lafayette, IN. • Analysis is broken into several sequential exercises. • Solutions will be provided.
Key Concepts • Average Intersection Delay (LOS) is relatively useless. • Delay for each lane group is useful. • volume/capacity ratio for each lane group is the most important MOE. • Must be careful with Arrival Type Values they are subjective and can skew analysis.
Lane HeadwayCapacity • 2 s/v 1800 v/h • 3 s/v 1200 v/h • 4 s/v 0900 v/h
Example • 2 Lanes, 30 seconds of green, 120 second cycle • Lane Capacity= (gi/C) * 1800 • 1 Lane30/120*1800=450 veh per hour • 2 lanes 900 veh per hour • Life is good if demand is say less then 800 vph • Life is bad if demand is >900 vph
Factors effecting Saturation Flow Rate • Lane Width • Heavy Vehicles • Grade • Parking • Pedestrians • RT Radius • Opposing Volume on perm Left Turns
Delay LOS • ~280 sec of delay for 7 vehicles • ~No delay fro additional 10 vehicles • Avg Delay 280/17=16.5 s/vLOS “B” • Lane Utilization FLU
Arrival Type is Very Important • Arrivals on Red incur significant delay • Arrivals on Green incur minor delay