Download
1 / 1
10 likes | 139 Vues
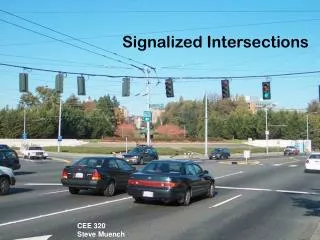
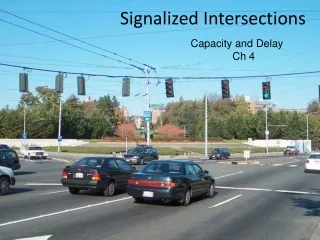
This study focuses on the signalized intersection of Clifton Ave. and MLK Dr. in Cincinnati, OH, aiming to decrease delay and CO emissions caused by improper traffic signal configurations. Through field data collection and analysis, alternative solutions are proposed for optimizing signal timing and left turn storage lengths, leading to reduced delays and CO emissions. Implementing these alternatives not only benefits air quality but also saves costs incurred due to vehicle delays. Evaluation results show significant improvements in traffic flow and environmental impact, supporting the implementation of the proposed solutions.

E N D
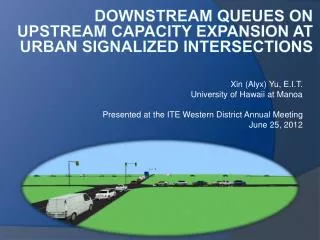
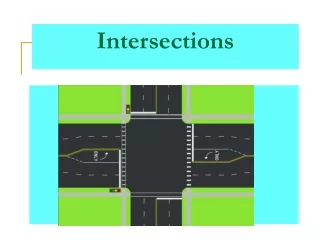
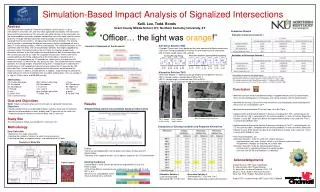
Kelli. Lee, Todd. Bonds Abstract The signalized intersection of Clifton Ave and Martin Luther King Dr is a busy intersection in Cincinnati, OH. Like any other signalized intersections, the intersection delay and the large amount of CO emission from idling vehicles at the intersection are two major problems caused by improper configurations of traffic signal and intersection geometry. Through field data collection and microscopic simulation based analysis, it is proved that the intersection is not operating at the optimal condition. The existing level of service is unbalanced for different movements and the southbound left turn is rated “F” in its existing condition, which is unacceptable. The conducted analysis on the correlation between delay and CO concentration identifies that longer stopped delay will cause higher CO concentration in the air. Finally, the teachers propose two alternative solutions to the intersection that would decrease both the overall delay and the CO emission into the air under the simulation environment. The first alternative solution optimizes the timing and phasing of the traffic signal. It would result in a decrease in the overall delay by 2.9 seconds per vehicle and in turn decrease the amount of overall CO emission by 1.92 grams per hour. The second alternative solution optimizes the storage lengths of two left turning lanes. It would result in a decrease in overall delay of 4.87 seconds per vehicle and also reduce the CO emission by 4.35 grams per hour. In other words, implementing the alternatives would improve the amount of clean air, which is a health benefit. In addition, implementing the alternatives would reduce the amount of workforce lost caused by vehicle delay. That is a savings of as high as $126 an hour, or $138,648 annually. Abbreviations: CO: Carbon Monoxide MLK: Martin Luther King hr: hour EB: Eastbound NB: Northbound WB: Westbound SB: Southbound LT: Left Turn RT: Right Turn T: Through sec: second veh: vehicle Ft: feet ppm: particles per million g: gram G: Green Time Y: Yellow Time R: All Red Time LOS: Level of Service Grant County Middle School, KY; Northern Kentucky University, KY Evaluation Results “Officer… the light was orange!” Evaluation of Alternative Solution 1 • Alternative Solution ONE • Changes Phases from 4 to 6 based on the traffic demand of different movements; • Optimizes Timing accordingly to minimize the overall delay of the intersection. And, the cycle length remains 90 seconds. • Alternative Solution TWO • Alternative Solution 1+ optimizing storage lengths for two different left turns; • SB LT storage length is reduced from 452ft to 201 ft; • WB LT storage length is increased from 132ft to 291ft; • Taking away left turn option on the EB MLK to enter Brooklyn Dr. Heuristic Framework of the Research Phase 5 Phase 6 Phase 1 Phase 2 Phase 3 Phase 4 Phase 1 Phase 2 Phase 3 Phase 4 Evaluation of Alternative Solution 2 Alternative Solution 1: Optimized Phasing/Timing Existing Phasing/Timing G: 4.0s Y: 3.0s R: 1.0s G: 9.0s Y: 3.0s R: 1.0s G: 0.5s Y: 3.0s R: 1.0s G: 24.0s Y: 3.6s R: 2.4s G: 13.5s Y: 3.6s R: 2.4s G: 11.0s Y: 3.0s R: 1.0s G: 11.0s Y: 3.0s R: 1.0s G: 6.0s Y: 3.0s R: 1.0s G: 38.0s Y: 3.6s R: 2.4s G: 15.0s Y: 3.6s R: 2.4s Simulation-Based Impact Analysis of Signalized Intersections Calculations are based on the following facts. Average hourly salary in US is $20.32/hr (US Bureau of Labor Statistics, 2010); Total number of vehicles traveling through the study intersection in 1 hour is 4589; The average exhaust emission factor for light vehicle is 1.23g/hr/veh (EPA, 2009); The average exhaust emission factor for heavy vehicle is 33.60g/hr/veh (EPA, 2009). Conclusion • Identified a certain relationship between delay of stopped vehicles and CO concentration. There are correlated patterns on the peaks and valleys of Delay and CO Concentration. • Identified the existing LOS of the turning movements are unbalanced, and the Southbound left turn has an unacceptable LOS F. • Identified the overall emitted CO of the study site is 44.97g/hr. • Implementation of Alternative Solution 1 deceases the delay by 7.78%, and decreases the CO emission by 4.26%, compared with the existing condition. In terms of money, Alternative Solution 1 saves $67.15 per hour due to the improvement of delay at the study site. That is a saving of $73,529 per year. • Implementation of Alternative Solution 2 deceases the delay by 14.67%, and decreases the CO emission by 9.68%, compared with the existing condition. In terms of money, Alternative Solution 2 saves $126.62 per hour due to the improvement of delay at the study site. That is a saving of $138,648 per year. • Final recommendations are: • Alternative Solution 1 to be the short-term solution because: • Implementation only takes 2 hours, which is cost efficient and time effective. • No geometric changes are required, no surface work. • Alternative Solution 2 to be the long-term plan because: • Surface work is required to change the storage lengths. • Left turn from EB MLK to Brooklyn Dr is blocked. • Goal and Objectives • Goal: Improve vehicular delay and CO emissions at signalized intersections. • Objectives • Identify whether there is a relationship between vehicles’ delay and CO emission; • Identify existing conditions in terms of delay and CO emission for the study site; • Propose alternative solutions to minimize delay and CO emission. • Study Site • The intersection of Clifton Ave and MLK Dr, Cincinnati, OH. WB LT storage length existing Results Stopped Delay and CO Concentration based on Observation WB LT storage length increased SB LT storage length existing SB LT storage length reduced Methodology Evaluations of Existing Condition and Proposed Alternatives • Data Collection • Geometry of the study intersection; • Counting the number of vehicles for each turning movement; • Counting the delay of stopped vehicles and collecting the CO data. Wheel Measurer Geometry of Study Site • Findings • There are correlated patterns on the peaks and valleys of Delay and CO Concentration; • The delay of the stopped vehicles has an obvious impact on the CO concentration. Acknowledgements Traffic Counter • Existing Conditions • Overall delay is 33.19 sec/veh giving the existing condition a LOS of C, which is good; • LOSs of the different movements are unbalanced, for example, EB T is a B, SB T is a D; • SB LT has an unacceptable LOS F; • Overall emitted CO is 44.97g/hr. Andrea Burrows, RET Grant Coordinator Dr. Anant Kukreti, RET Project Director Dr. Heng, Wei, Associate Professor, Ph.D., P.E. Zhixia Li, Ph.D. Student, Research Assistant Zhuo Yao, Ph.D. Student, Research Assistant Project RET is funded through NSF Grant # EEC-0808696 • Alternative Solution 2 • Eliminated SB LT LOS from F to C • Better delay compared to Alternative Solution 1 • Alternative Solution 1 • LOS more balanced • Eliminated SB LT LOS F to D