Download

1 / 16
160 likes | 318 Vues
The Student Success Scorecard. Dr. Matt Wetstein Interim Vice President of Instruction April 16, 2013. Outline. Describe elements of the Student Success Scorecard Provide data on Delta College Examine 5-years of trend data on selected measures Discuss equity gaps in the scorecard metrics

E N D
The Student Success Scorecard Dr. Matt Wetstein Interim Vice President of Instruction April 16, 2013
Outline • Describe elements of the Student Success Scorecard • Provide data on Delta College • Examine 5-years of trend data on selected measures • Discuss equity gaps in the scorecard metrics • Discuss the usefulness of the scorecard for college planning
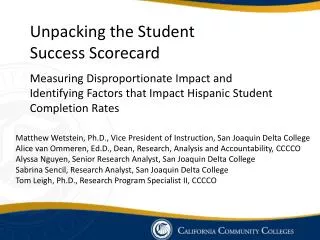
Introduction • Scorecard is mandated in the Student Success Act of 2012 • Task Force established in summer of 2012 to revise the ARCC data elements • Data disaggregation by age, ethnicity, gender • Data disaggregation by college-prepared and unprepared • Provides rates of success, completion, persistence for different types of students
Scorecard Metrics • Cohort of first-time entering students with intent to transfer who take 6 units or more • Students are tracked for 6 years to determine completion of benchmark milestones • Most recent cohort started in the 2006-07 academic year • Delta’s cohort averages between 2,100 and 2,800
Scorecard Metrics • Persistence – The percentage of degree or transfer seeking students who enroll for three consecutive terms • 30 units – The percentage of the cohort who complete 30 units within 6 years • Completion – The percentage who complete a degree, certificate, transfer or 60 units within 6 years
Scorecard Metrics • Remedial Education – The percentage of the entering cohort who started below transfer level in English, Math or ESL who complete college level course in the same discipline • Career Technical Education – The percentage who enrolled in 6 units or more in a single CTE discipline who completed a degree or certificate within 6 years
Persistence Statewide Average 62.2 67.3 65.8
30 Units 70.1 65.1 66.4
Completion 41.1 71.2 49.2
Remedial Education 37.0 38.1 23.6
Scorecard Metrics Over Time Completion rates at the college are highest for Asian and white students Rates are lowest for Native Americans, African Americans, and Pacific Islanders More student in these segments of the cohort enter the college unprepared for college level Math and English
Usefulness of the Data • Transparent benchmarks for public and students • Useful for the setting of standards for institutional performance • Useful for starting conversations within the college • What is an acceptable rate for each of the metrics? What is an acceptable rate for various groups of students within the cohort? • What can be done to address equity gaps?
Usefulness of the Data: an Example • Data suggest that even among college prepared students, African Americans are 20% less likely to reach transfer or degree completion than whites and 40% less likely than Asians • African Americans are the least likely in the cohort to make it to the benchmark of 30 units • Financial aid • PT vs. FT status • Outreach and support services are more essential
Next Steps • President’s Council will be asked to set reasonable standards of institutional performance on the Scorecard measures • Program faculty will be asked to discuss and set reasonable goals for program completion in program review documents • PRIE Research Analysts will examine multivariate models of student success to untangle the impacts of poverty, college preparedness and program interventions