Download
1 / 12
120 likes | 133 Vues
The Multidimensional Detective is a tool that focuses on the discovery process, finding patterns and trends in datasets with multiple parameters and variables. It uses parallel coordinates to simplify the recognition of patterns, making it easier to identify interrelationships and dependencies among variables. The tool supports queries, works for any number of dimensions, and allows for projective transformations. Two examples - VLSI chip production and trade-off analyses in a nation's economy - demonstrate the effectiveness of the Multidimensional Detective in uncovering valuable insights.

E N D
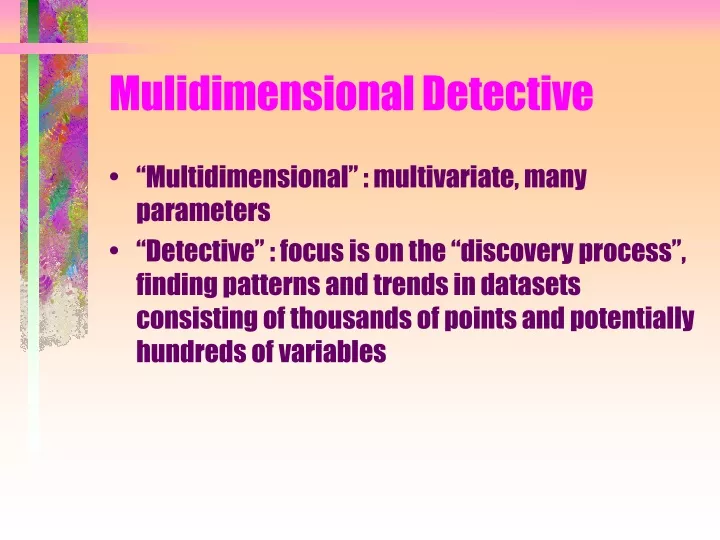
Mulidimensional Detective • “Multidimensional” : multivariate, many parameters • “Detective” : focus is on the “discovery process”, finding patterns and trends in datasets consisting of thousands of points and potentially hundreds of variables
Displaying datasets in parallel coordinates • allows simplification to a 2-D pattern recognition problem • makes it easier to find interrelationships and dependencies among variables
Parallel coordinates • Cartesian and Parallel representations of the same line
Properties of parallel coordinate problems • complexity is O(N), since number of axes = number of dimensions (variables) • conveys information intuitively for N-dimensions, works for any N • display can be used with a projective transformation (e.g. rotation, translation, scaling, perspective) • every variable is treated uniformly
Design of queries • queries should be able to operate in parallel coordinates • should be intuitive and well-chosen • combine “atomic” queries to form complex queries suitable to cut the dataset of a parallel coordinate display
Example 1: VLSI chip production • 473 batches of VLSI chips, measuring 16 process parameters • X1 = yield, X2 = quality, X3-X12 = other physical parameters • scale is inverted, so 0 appears at top of || coordinate display • objective: raise yield while maintaining high quality
Obtaining visual cues • batches having highest X1 and X2 were isolated • X15 showed separation into two clusters • some batches low in defect X3 were not in these batches • conclusion: some defects may be beneficial to the high yield, high quality goal
Removing the zero-defect constraint • batches with zero defects in 9 out of 10 defect types were isolated • result: all of these batches have low yield and low quality (unexpected) • when defects are allowed in X6, X3, and X15, the highest yields and highest quality batches are obtained • gap in X15 was obtained by simultaneously imposing the yield and quality constraints
Example 2: nation’s economy • trade-off analyses, discovering sensitivities, understanding impact of constraints • dataset is outputs of various economic sectors of a nation (e.g. Agriculture, Mining, etc.) • parallel coordinates used with “Least Squares” method to obtain a visual model for the economy
Interpreting the economic model • hyperplanes are constructed using the interior point algorithm • value for 1st variable is chosen • available range for 2nd variable is reduced by 1st variable constraint • continues for all remaining variables • any hyperplane within the upper and lower boundaries is a feasible economic policy • allows us to see impact of decisions “downstream”
Interpretation continued • able to see that a low initial values for agriculture correspond to low values for fishing, and high values for agriculture correspond to high values for fishing • conclusion: it is not possible to have a policy that favors agriculture without also favoring fishing
Interpretation continued • high values for fishing correspond to low values for mining, and vice-versa • further investigation revealed that the nation had a large number of migrant workers, who worked in both fishing and mining • competition for the same labor pool for these two industries