Download
1 / 17
170 likes | 292 Vues
The ACES (APEC Cooperation for Earthquake Simulation) program fosters global collaboration among scientists to enhance earthquake and tsunami prediction. Launched to advance understanding of seismic events, ACES focuses on predicting occurrences and analyzing consequences, laying the groundwork for innovative earthquake simulations. As the program explores the integration of information technology and computational frameworks, it aims to develop hazard mitigation tools and support international research partnerships, vital for disaster preparedness in a rapidly changing world.

E N D
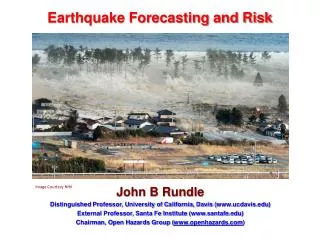
Earthquake ForecastingInteroperability GGF17 Grid Interoperability Session Tokyo Japan May 11 2006 Geoffrey Fox Computer Science, Informatics, Physics Pervasive Technology Laboratories Indiana University Bloomington IN 47401 http://grids.ucs.indiana.edu/ptliupages/presentations/ gcf@indiana.eduhttp://www.infomall.org
APEC Cooperation for Earthquake Simulation • ACES is a seven year-long collaboration among scientists interested in earthquake and tsunami predication • Primary goal predicting event occurrence; other related work discusses consequences of event(Earthquake Engineering) • http://www.quakes.uq.edu.au/ACES/ • Chartered under APEC – the Asia Pacific Economic Cooperation of 21 economies
100 Years After the San Francisco Earthquake It is now known that the M ~ 7.9 San Francisco earthquake and fire of April 18, 1906 killed more than 3000 persons. Estimates are that if such an event were to happen again today, damages could easily total well in excess of $500 Billion, with potential fatalities of many thousands of lives. Ruins of financial district (Museum of San Francisco collection)
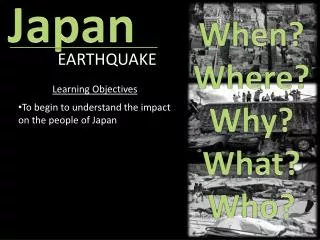
The 2nd ACES Workshop on October 15-20, 2000 in Tokyo & Hakone More than 100 researchers in earthquake physics and computational science participated in this workshop from around the world.
CSIRO Australia Monash University Australia University of Western Australia, Perth, Australia University of Queensland Australia University of Western Ontario Canada University of British Columbia Canada China National Grid Chinese Academy of Sciences China Earthquake Administration China Earthquake Network Center Brown University Boston University Jet Propulsion Laboratory Cal State Fullerton San Diego State University UC Davis UC Irvine UC San Diego University of Southern California University of Minnesota Florida State University US Geological Survey Pacific Tsunami Warning Center PTWC Hawaii National Central University, Taiwan (Taiwan Chelungpu-fault Drilling Project) University of Tokyo Tokyo Institute of Technology (Titech) Sophia University National Research Institute for Earth Science and Disaster Prevention (NIED) Japan Geographical Survey Institute, Japan Participating Institutions
In its first seven years, ACES has: Enhanced international cooperation and understanding Stimulated new computational science and technology Laid the foundations for a the new field of earthquake simulations Established earthquake science that is analytical and predictive rather than simply descriptive & observational In its second five years, ACES must: Exploit inevitable “data deluge” and detailed simulations across micro to macro scales Develop a series of science-based hazard mitigation products Centralize the role of information technology with cross economy infrastructure Expand the membership to include other economies Support integrated science and products of publicinterest across the member economies iSERVO International Solid Earth Research Observatory(synergy with other sciences!)
Deformation in the Eastern Mojave Shear Zone (Courtesy G. Peltzer, UCLA) 1992 Landers, California Earthquake (Courtesy H. Zebker, Stanford) Role of Space Technology Synthetic Aperture Radar Interferometry (InSAR) can detect changes (both large and small) in surface deformation of the earth’s crust over synoptic scales. At present we are limited to isolated, static images.
Role of Information Technology and Grids in ACES Numerical simulations of physical, biological and social systems Engineering design Economic analysis and planning Sensor networks and sensor webs High performance computing Data mining and pattern analysis Distance collaboration Distance learning Public outreach and education Emergency response communication and planning Geographic Information Systems Resource allocation and management
6 ≤ M 5 ≤ M ≤ 6 Background: Earthquake Forecast – Published Feb 19, 2002, in PNAS. ( JB Rundle et al., PNAS, v99, Supl 1, 2514-2521, Feb 19, 2002; KF Tiampo et al., Europhys. Lett., 60, 481-487, 2002; JB Rundle et al.,Rev. Geophys. Space Phys., 41(4), DOI 10.1029/2003RG000135 ,2003. http://quakesim.jpl.nasa.gov) Color Scale Decision Threshold D.T. => “false alarms” vs. “failures to predict” Eighteen significant earthquakes (M > 4.9; blue circles) have occurred in Central or Southern California. Margin of error of the anomalies is +/- 11 km; Data from S. CA. and N. CA catalogs: After the work was completed 1. Big Bear I, M = 5.1, Feb 10, 2001 2. Coso, M = 5.1, July 17, 2001 After the paper was in press ( September 1, 2001 ) 3. Anza I, M = 5.1, Oct 31, 2001 After the paper was published ( February 19, 2002 ) 4. Baja, M = 5.7, Feb 22, 2002 5. Gilroy, M=4.9 - 5.1, May 13, 2002 6. Big Bear II, M=5.4, Feb 22, 2003 7. San Simeon, M = 6.5, Dec 22, 2003 8. San Clemente Island, M = 5.2, June 15, 2004 9. Bodie I, M=5.5, Sept. 18, 2004 10. Bodie II, M=5.4, Sept. 18, 2004 11. Parkfield I, M = 6.0, Sept. 28, 2004 12. Parkfield II, M = 5.2, Sept. 29, 2004 13. Arvin, M = 5.0, Sept. 29, 2004 14. Parkfield III, M = 5.0, Sept. 30, 2004 15. Wheeler Ridge, M = 5.2, April 16, 2005 16. Anza II, M = 5.2, June 12, 2005 17. Yucaipa, M = 4.9 - 5.2, June 16, 2005 18. Obsidian Butte, M = 5.1, Sept. 2, 2005 CL#03-2015 Plot of Log10(Seismic Potential) Increase in Potential for significant events, ~ 2000 to 2010
Status of World Forecast - Jan 1, 2000 ~2010 Circles are events M > 7 since Jan 1, 2000
Interoperability Summary • Need to define common infrastructure and domain specific standards • Not too many “historical” constraints; could adopt GT4, OMII, …… • Build Interoperable Infrastructure gatewayed to existing legacy applications and Grids • Generic Middleware • Grid software including workflow • Portals/Problem Solving environments incl. visualization • We need to ensure that we can make security, job submission, portal, data access (sharing) mechanisms in different economies interoperate • Geographic Information Systems GIS • Use services as defined by Open Geospatial Consortium (Web Map and Feature Services) http://www.crisisgrid.net/ • Earthquake/Tsunami Science Specific • Satellites, sensors (GPS, Seismic) • Fault, Tsunami … Characteristics stored in databases • QuakeTables developed by SERVOGrid can be used Internationally
JST-CREST Integrated Predictive Simulation System Strong Motion and Tsunami Generation Earthquake Generation Tsunami Generation Plate Motion Tectonic Loading EarthquakeRupture Wave Propagation Structure Oscillation Artificial Structure Oscillation Crustal Movement Data Analysis Seismic Activity Data Analysis Strong Motion Data Analysis GONET K-NET GIS Urban Information Hi-net Database for Model Construction Simulation Output Platform for Integrated Simulation Data Processing, Visualization, Linear Solvers PC clusters for small-intermediate problems Earth Simulator for large-scale problems
Japanese Earthquake Simulation Grid Data-Server NIED 48xG5, 15TB PC Cluster ERI, 64xOpteron paraAVS Data-Server GSI 8xOpteron 20TB Integrated Observation-Simulation Data Grid PC Cluster EPS, 64xOpteron paraAVS Super SINET (10Gbps) Earth Simulator 5,120xSX6
Current PTWC Network of Seismic Stations (from GSN & USNSN & Other Contributing Networks)
Tokyo 6 ≤ M 5 ≤ M ≤ 6 Forecasting Shallow Earthquake Locations in Japan (<20 km Depth) Tokyo Area, Japan.JMA Catalog is used. (K. Nanjo, JBR, J Holliday, DLTurcotte, 2004). Plot of Log10 (Seismic Potential) Forecast for the period: January 1, 2000 ~ December 31, 2010. Image at right was shown during lectures at Kyoto University October 13, 2004 and at Tokyo University, October 14, 2004. Copies are available from Professor James Mori, Kyoto U. or Professor Mitsuhiro Matsu’ura, Tokyo U. Figure by by K. Nanjo The October 23, 2004, M = 6.8 Niigata, Japan earthquake killed at least 37 people and injured thousands. Its main shock and principal aftershocks with M 5 are shown (arrow).