Soil Sample Testing
Soil Sample Testing. 29278 US Highway 119 N Belfry, KY 41514 USA. Objective.


Soil Sample Testing
E N D
Presentation Transcript
Soil Sample Testing 29278 US Highway 119 N Belfry, KY 41514 USA
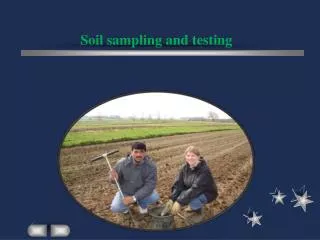
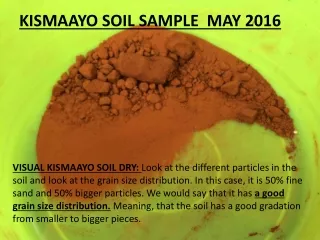
Objective Students at Belfry High School were interested in studying the chemical compositions of the soil in Thornsberry Hollow and Pigeon Roost mountains where the herbs of medicinal purposes are found in abundance. GPS system was used to map the sites to locate for further investigations at these sites later.Soils from five different locations were collected and tested at our school using the LaMotte soil test kit provided by the Tracy Farmers institute and also the soil research lab at Lexington. It was observed that some soils were acidic and some were basic. The soil was rich in potassium, calcium and magnesium and found traces of phosphorous and zinc.
Nitrogen Test Filled test tube with nitrogen extracting solution to line 7. Added 2 measures of soil sample using 0.5 g spoon. Capped and mixed gently for 1 min. Used clean pipette to transfer the clear liquid into another test tube. Add nitrogen indicator powder to the extract using a 0.25 g. Capped and mix gently until a pink color appeared above the powder. Matched the color with nitrogen color chart. Results are reported in the table. Phosphorous Test Filled test tube with phosphorous extracting solution to line 6. Added 3 measures of soil sample using 0.5g spoon. Capped and mixed gently for 1 min. Clean pipette was used and clear solution was added to a second test tube. Added 6 drops of phosphorous indicator reagent to the soil extract and mixed well. Added phosphorous test tablet and observed appearance of a blue color and matched with phosphorous color chart. Results are reported in the table. Experimental setup using LaMotte Soil Test Kit at Belfry High School Potassium Test Filled the test tube with potassium extracting liquid to line 7. Added 4 measures of sample using 0.5 g spoon. Capped and shaken vigorously for 1 minute. Clean pipette was used to take clear solution and filled the second test tube to line 5. Added potassium indicator tablet until it dissolves. A purplish color appeared . Added potassium test solution two drops at a time and noted the drops till the purple color changed to blue. Results are reported. pH Filled the test tube with a pH indicator to line 4. Added 3 measures of soil using 0.5g spoon. Cap and mix gently for one minute and allow the tube to stand for 10 minutes to let soil settle. Match the color with pH color chart.
Experiments using LaMotte Soil Test Kit at Belfry High School
Soil is oven-dried at 38oC and ground to pass a 2 mm screen. A soil-water paste is created by adding 10 ml of water to 10 cm3 of soil and stirring for with a glass rod and letting stand for at least 15 minutes but not more than 2 hours. A glass electrode is placed in the mixture to measure pH. After pH measurement, 10 ml of Sikora Buffer (a mixture of triethanoloamine, imidazole, MES, acetic acid, and KCl) is added to the soil-water paste and shaken for 10 minutes. A glass electrode is then placed in the mixture to measure Buffer pH within 2 hours after shaking. Soil pH and buffer pH are reported as unit less values. Test Method For Soil Analysis at Soil Testing Laboratory at University of Kentucky Phosphorus, K, Ca, Mg, and Zn are determined in a Mehlich III extract which contains 0.2 N acetic acid, 0.25 N NH4NO3, 0.015 N NH4F, 0.013 N HNO3, and 0.001 N EDTA. Twenty ml of Mehlich III extract is added to 2 cm3 soil, shaken for 5 minutes, and immediately filtered through Whatman #2 filter paper. Filtration is terminated at the end of 10 minutes. The filtrate is analyzed via ICP (inductively coupled plasma spectroscopy). The analytes are reported as lbs of nutrient / acre of land. The assumptions made with this reporting is that an acre of land contains 2 million pounds of soil and the density of air-dried ground soil is 1 g/cm3.
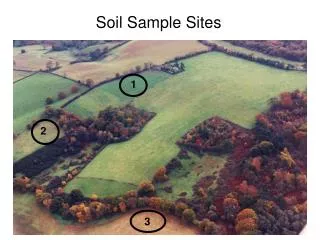
Mapping the Field GPS system donated by Tracey Farmers Institute was used to locate the position of sites where the soil was excavated.
Results Table represents the results of the soil test conducted at Belfry High School using LaMotte Soil Test Kit provided by Tracey Farmers Institute, University of Kentucky, Lexington, KY.
Results Table represents the results of the soil test conducted at Soil Testing Laboratory, University of Kentucky, Lexington, KY. OM – Soil organic matter; TN – Total Nitrogen. Soil is oven-dried at 38oC and ground to pass a 2 mm screen. One-half gram of soil is weighed in porcelain boats and injected into a dry combustion instrument (LECO or Elementar). The instrument determines %C in the material. Organic matter is calculated as %C x 1.72= % organic matter. Organic matter is reported as % by weight of air-dried soil. Soil is oven-dried at 38oC and ground to pass a 2 mm screen. One-half gram of soil is weighed in porcelain boats and injected into a LECO combustion instrument. The instrument determines %N in the material by measuring the N2 gas emitted upon combustion. Nitrogen is reported in units of lbs/acre assuming 2 million pounds of soil are in an acre (% x 20,000 = lbs/acre).
Discussion In this present work, we have located the herbs namely hydrangea, sassafras, ginseng, winter green and lycopodium that are used for medicinal purposes in a nearby pigeon roost mountain. GPS system was used to locate the points in which these herbs were grown.Different samples of the soil were excavated to study the chemical compositions to understand the environment in which these herbs are grown. Two different laboratory facilities were used to test the soils chemical composition. There is a good agreement between the values of pH, Nitrogen and potassium obtained from two different laboratories. Experimental values of pH suggest that samples A, B and C have more acidity compared to samples D, E and F.
We would like to thank our administration for all the help rendered in completing this project. We would like to thank Mr. Anthony Tackett for providing information about the herbs and taking us to pigeon roost mountain to collect the samples. We are grateful to Mr. Brian Radcliffe for providing us the GPS system and LaMotte soil testing kit to perform the experiments. We appreciate Dr. Carol Hanley and her staff from the NSF-ITEST grant provided by Tracy Farmer Institute, University of Kentucky are providing the grant to carry out this research. We also appreciate the help provided by our mentors Dr. Chandran and Ms. Smith in the form of valuable suggestions to complete the project successfully. Acknowledgments