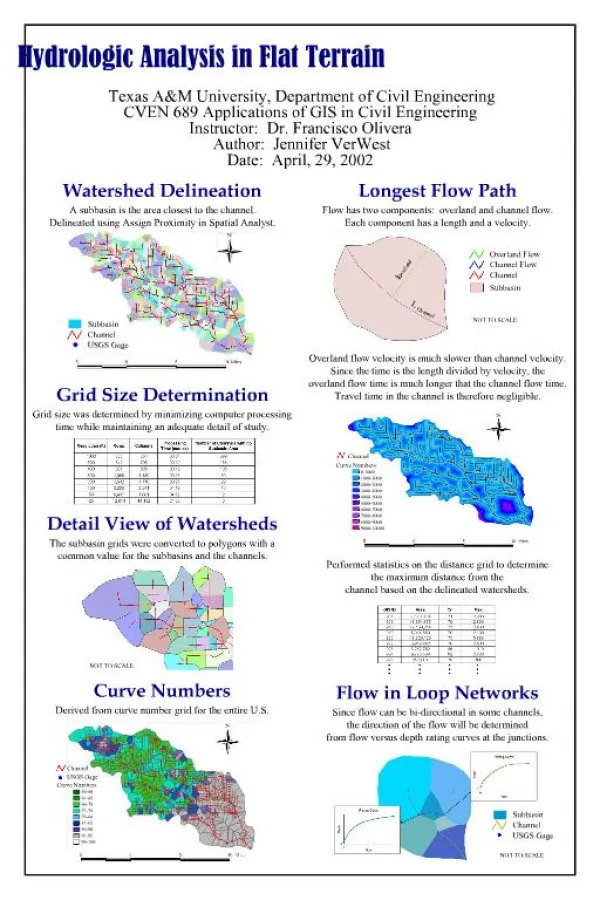
Download

1 / 74
740 likes | 1.07k Vues
Terrain Analysis Brian McGinness N3OC. Terrain Analysis. Now that we know what angle signals arrive at, and what effect antenna height has on takeoff angle, what about the effects of the terrain?. Terrain Analysis. We have been showing you a scientific approach to designing

E N D
Terrain Analysis Now that we know what angle signals arrive at, and what effect antenna height has on takeoff angle, what about the effects of the terrain?
Terrain Analysis • We have been showing you a scientific approach to designing • your contest station antenna systems. • Know what arriving signal angles must be covered. • Model the antennas and their height and design your system • to cover those angles. • Be aware of the effects of terrain and take corrective action, • if required.
N3OC to Europe N3OC to Europe – 10 miles out, using Delorme TopoQuads.
N3OC to Europe Delorme Topo3D shows desired downhill terrain out to one mile. But at 2-3 miles out, there is undesirable uphill terrain. What effect does this have on HF signals?
ARRL’s HFTA Software One way to answer the question is to purchase the ARRL Antenna Book, which includes HF Terrain Assessment software. HFTA uses public USGS terrain data to model the effects of terrain on your HF signal.
Effects of Terrain Generally speaking, flat terrain will produce an even, bell-curve plot on HFTA, on all bands. This is really the lobes of the antenna pattern that you see when modeling an antenna, shown vertically.
Effects of Terrain Here is the same antenna, shown on EZNEC. Note the main lobes at 12 degrees and 32 degrees.
Effects of Terrain Terrain that slopes down from the antenna will enhance the low angles. This antenna now needs to be lowered a bit on the tower to compensate for the terrain.
Effects of Terrain This really becomes a problem on 10 meters! Beware of “mountain” QTHs with too high of an antenna, especially on 10 meters.
Effects of Terrain As you might now expect, uphill terrain enhances the high angles, and impairs the low angles. This slide shows the effects on 20 meters, where the gain at low angles has dropped by 5db!
Effects of Terrain Here are the effects on 10 meters. Our antenna that was too high for flat and downhill terrain is starting to look a little better! (But still needs to be lowered or stacked).
HFTA Case Studies The first example will be a real-world example of a somewhat compromised antenna system, a tribander stack, with average terrain. Since the antennas have to cover three bands, they cannot all be at the optimal height for each band. In this example, the antennas are of the typical “multi-monobander” type of tribander, and are located at 100’, 63’ and 33’. These are not ideal heights, but they are what work on a 100’ tower due to the constraints of the guy wires.
Obtaining Terrain Data for HFTA Data must be downloaded and prepared before you can use HFTA. First, you must download the terrain data, centered on your antenna location. Then the street map data is merged with the terrain data. Use of the street map data is optional. Finally, terrain azimuth files are created from the terrain data that you have assembled. There is one file for each five degrees of the compass, from the base of your tower out to 4400 meters.
Obtaining Terrain Data for HFTA Alternatively, you can create your own terrain data files by using topographical maps and a text editor. These files contain the terrain elevation in meters, every thirty meters. Terrain data is available for download in the DEM (digital elevation model) or NED (national elevation dataset) formats. Each format has it’s pros and cons. We will use the NED format in the following examples.
Downloading Terrain Data NED data is available at: http://seamless.usgs.gov/
Defining the Data Limits Limits are defined 1/10th of a degree each direction from the base of your tower.
Request Summary Page Once the limits and output format (tiff) are defined, the data is downloaded to your computer.
Downloading & Saving the Data The data is then saved to your hard drive. NED Data is saved in the C:\mapdata\DEMs directory.
Opening the Data in MicroDEM The NED data is unzipped, then opened using MicroDEM.
Opening the Data in MicroDEM There is no street data yet, just raw elevation data.
Download Street Map Data (optional) Street data can be downloaded at: http://www.census.gov/geo/tiger99/tl_1999.html
Find the FIPS Number & Download Data Montgomery is 24 031 and Howard is 24 027
Save the Street Data Tiger street data is saved in the C:\mapdata\tiger subdirectory
Return to MicroDEM & Merge Map Data Click on Vector Overlay icon. N3OC QTH needs two counties.
Entering Weapons & Viewshed Parameters Click the Weapons Fan icon, then double-click anywhere on map
Enter Tower Location Enter the coordinates of your tower base.
Enter ViewShed Parameters Enter the parameters for the radial files. These settings will produce radial files every 5 degrees out to 4400 meters from your tower base.
Specify Radials File Name Give a meaningful name to your radial files. MicroDEM will append the degree bearing to this name for each file.
MicroDEM Creates 71 Radial Files These radial files contain elevation data every 30 meters from the tower base out to 4400 meters, every 5 degrees.
MicroDEM Creates 71 Radial Files HFTA will use these files to model the effects of this terrain on your antennas.
Setting up HFTA Analysis Select a radial elevation file for your location and the direction of interest, and enter your antenna type and height.
Setting up HFTA Analysis Also you can select the profile for flat terrain to use as a comparison.
Setting up HFTA Analysis Select an elevation file to use as a reference for arriving signal angles. We are using W3LPL’s angle data instead of the data that comes with the program.
Resulting Terrain Profile Profile of the terrain as specified in the N3OC-45 terrain radial file. Note the antenna heights are shown too.
HFTA Terrain Plot for N3OC to Eu on 20m The blue plot shows gain (in dbi) of N3OC’s terrain, and the red plot shows flat terrain, using a 3/3 stack at 100 & 63 feet, on 20 meters.
HFTA Terrain Plot for N3OC to Eu on 20m Purple bars show arriving signal angles that need to be covered to Europe, using W3LPL’s data.
HFTA Terrain Plot for N3OC to Eu on 20m Normally the program uses angle data referenced to the frequency that a particular angle produces propagation. Some of these angles appear unreasonable.
HFTA Terrain Plot for N3OC to Eu on 20m Conclusion is that my terrain slightly helps the signal to Europe on 20m, compared to flat terrain, on the lower angle paths. Not enough to worry about, and may not be noticeable.
HFTA Terrain Plot for N3OC to Eu on 15m Lets start on 15m by having a look at the stack compared to flat terrain, to evaluate the effects of the terrain on this band.
HFTA Terrain Plot for N3OC to Eu on 15m The downhill terrain has shifted the angles a little to the left, and chewed up the plot a bit, but probably not enough to worry about.
HFTA Used to Evaluate Stacks HTFA can also be used to evaluate the angle coverage of individual antennas, and stacks, referenced to the arriving signal angles that need coverage.
HFTA Used to Evaluate Stacks This complicated slide shows the plots for the stack (blue), the upper antenna (red), the middle antenna (green), and the lower antenna (cyan). Lets look at them one at a time for simplicity!
HFTA Used to Evaluate Stacks First, the upper antenna at 100’. Note the deep nulls at 14 degrees. This antenna covers the low angle paths nicely, but is no good for the high angles.
HFTA Used to Evaluate Stacks Next, the middle antenna at 63’. This antenna covers the middle angles, except at 10 degrees thanks to the terrain. If you had to pick one antenna, this would be the one, mounted a little higher.
HFTA Used to Evaluate Stacks Here is the bottom antenna at 33’. This is obviously high-angle antenna, probably best suited for sweepstakes!
HFTA Used to Evaluate Stacks Finally, the entire stack compared with flat terrain. The stack produces a few db of gain over the individual antennas. Gain is achieved by redirecting the energy to the desired angles.
HFTA Used to Evaluate Stacks Just for reference, here is the stack using just the upper two antennas.
HFTA Used to Evaluate Stacks And here it is using the lower two antennas.