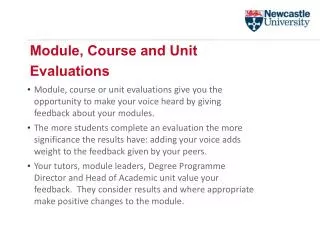
Planning For Evaluations Module 2
Planning For Evaluations Module 2. Essential Skills Series: An Introduction to Evaluation Concepts and Practice Canadian Evaluation Society. Date:_________________ Location:______________. Workshop Agenda. Registration 8:30 - 9:00 a.m. Evaluation Frameworks 9:00 - 10:00 a.m.

Planning For Evaluations Module 2
E N D
Presentation Transcript
Planning For Evaluations Module 2 Essential Skills Series: An Introduction to Evaluation Concepts and Practice Canadian Evaluation Society Date:_________________ Location:______________
Workshop Agenda • Registration 8:30 - 9:00 a.m. • Evaluation Frameworks 9:00 - 10:00 a.m. • Logic Models 0:00 - 10:15 a.m. • Break 10:15 - 10:30 a.m. • Logic Models (continued) 10:30 - 12:00 p.m. • Small group exercises • Lunch 12:00 - 1:00 p.m. • Performance Measurement Plan 1:00 - 2:15 p.m. • Small group exercises • Break 2:15 - 2:30 p.m. • Performance Measurement Plan (continued) 2:30 - 3:00 p.m. • Evaluation Plan and Reporting Strategy 3:00 - 4:00 p.m. • Planning and Managing Frameworks 4:00 - 4:20 p.m. • Group discussion • Workshop Evaluation4:20 - 4:30 p.m.
Workshop Objectives • Understanding of evaluation frameworks • Understanding of logic models • Awareness of performance measurement plans • A basic understanding of evaluation planning and reporting • Awareness of principles for managing frameworks
Section 1. Evaluation Frameworks
Planning For Evaluations • Why Plan? • Increase understanding of evaluation process and rationale • Enhance relevance of evaluation for decision-making • Build support for ongoing performance measurement and evaluation • Help ensure data are available for eventual evaluation • Make the evaluation process “manageable” • Facilitate the coordination of efforts • When Does Planning Take Place? • Ideally, when the program or policy is being designed (evaluation framework) • Just before the evaluation is conducted
Evaluation and the Management Life-cycle Initial Situation Design an intervention Reconsider, redesign, expand, reduce or end Identify a need Program/Policy start-up IMMEDIATE OUTCOMES INTERMEDIATE OUTCOMES FINAL OUTCOMES Summative/Outcome/ Impact Evaluation Formative/Mid-term/Process Evaluation Needs Assessment Baseline Evaluation Framework Evaluability Assessment/ Planning Ongoing Performance/Outcome Monitoring/Measurement Source: Adapted from Birch-Jones, J., Integrating PM and Evaluation: Bridging the Chasm, CES-NCR, 2002.
Preliminary Considerations for Evaluation Plan Development • Why the evaluation is being conducted • Who the client is for the evaluation • The decisions the evaluation is intended to support • The evaluation questions that will provide the evidence to help with the decisions • The outline of linkages between inputs, activities, outputs, and outcomes for the proposed policy, program, initiative, or function (e.g., logic model, cause-and effect, and implementation theories) • Performance indicators and availability of performance information • The methods that would be appropriate for the evaluation • Time lines • Resource implications Source: Health Canada (July 2008) Evaluation Project Workplan Assessment Guide
Why is the Evaluation Being Conducted? And Who is the Client? • What decisions are to be taken? • Accountability? • Learning? • Who is the client / are the clients? • Internal vs. External • Staff and operational management vs. senior management • Line vs. policy • Others
What’s in a Framework? • Key Elements: • Profile/background/context • Results logic • Evaluation Issues/Questions • Performance Measurement + Evaluation Strategy • Framework is a “plan” for an evaluation • Blueprint for results-based management • Provides information on what a program, policy or initiative is expected to achieve and how this will be demonstrated
Evaluation Frameworks • One key to a good framework is understanding the need for the evaluation • The need for an evaluation may come from: • statutory/funding requirements • program sunset/renewal/redesign • senior management concern • combination • Rationale for evaluation will influence scope and focus: • knowing management’s rationale and level of support for the evaluation is key strategic information
Evaluation Frameworks • Another key to a good framework is understanding the program, policy, or initiative itself • How do you find out about a program? • review documents (reports, other studies, files, legislation) • conduct a review of literature • browse the website (if applicable) • examine program data (files and databases) • conduct interviews (managers, staff, clients) • observe program/staff in action • What do you find out? • how the program works • what’s important to the program • what’s working well and what’s not • potential evaluation issues • key information upon which to base the profile
Evaluation Frameworks: Profiles • What’s in a Profile? • The profile section: • describes the policy, program or initiative • provides context and rationale • provides a clear picture of what the policy or program or initiative is intended to achieve and how it intends to do so • Concise description of: • origin and rationale (demonstrated need for the program, policy or initiative) • resources allocated and how these will be used • key stakeholders including delivery partners and primary intended beneficiaries (clients or target population) • objectives of the program, policy or initiative and how these link to the organization’s strategic outcomes Source: Treasury Board Secretariat (2005). Preparing and Using Results-based Management and Accountability Frameworks. http://www.tbs-sct.gc.ca/eval/pubs/RMAF-CGRR/guide/guide_e.pdf. Accessed March 17, 2009.
Evaluation Frameworks • Tips for Developing a Good Profile • Keep in mind that you are trying to describe the program, not evaluate it (yet) • Use the key source documents available • Avoid cheerleading in the profile; use neutral wording • Have program staff write the profile; evaluator provides advice/suggestions • Be prepared to clarify objectives/goals that are not clear • Revisit the profile after developing the logic model to ensure consistency between stated and “actual” outcomes (rhetoric versus reality)
Section 2. Logic Models
Logic Models • A logic model identifies the linkages between the activities of a policy, program or initiative and the achievement of its outcomes • Serves as a “road map”, showing the chain of results connecting activities to the final outcomes and what progress looks like along the way • Logic models “test” whether a policy, program or initiative “makes sense” from a logical perspective • Provides a fundamental backdrop on which the performance measurement and evaluation plans are based Source: Treasury Board Secretariat (2005). Preparing and Using Results-based Management and Accountability Frameworks. http://www.tbs-sct.gc.ca/eval/pubs/RMAF-CGRR/guide/guide_e.pdf. Accessed March 17, 2009.
Logic Models: Key Elements • Inputs: The financial and non-financial resources used to produce outputs and accomplish outcomes. • Activities: An operation or work process internal to an organisation, intended to produce specific outputs (e.g. products or services). Activities are the primary link in the chain through which outcomes are achieved. • Outputs:Direct products or services stemming from the activities of a policy, program, or initiative, and delivered to a target group or population. Usually things you can count. • Outcomes:An external consequence attributed to an organisation, policy, program or initiative that is considered significant in relation to its commitments. Outcomes may be described as: immediate, intermediate or final (end), direct or indirect, intended or unintended. A good outcome statement represents the type of change wanted, includes reference to the target population or intended beneficiary and does not include reference to the how. Source: TBS Results-based Management Lexicon http://www.tbs-sct.gc.ca/rma/lex-lex_e.asp Accessed Dec 15, 2008
Logic Models: Flow Chart Example Inputs/
Logic Models: Flow Chart Example (2) Source: Adapted from “An Evaluation Framework for Community Health Programs”, The Center for the Advancement of Community Based Public Health, 2000.
_______ • _______ • _______ • _______ • _______ • _______ • _______ • _______ • _______ • _______ • _______ • _______ • _______ • _______ • _______ • _______ • _______ • _______ • _______ • _______ • _______ • _______ Logic Models: Results Chain Area Of Control Internal to the Organization Area of Influence External to the Organization Immediate Outcomes (Direct) Intermediate Outcomes (Indirect) Ultimate Outcome Inputs (Resources) Activities Outputs External Factors Efficiency Effectiveness Source: Treasury Board Secretariat, Results-based Management and Accountability Framework Guidance, 2001 www.tbs-sct.gc.ca/eval/pubs/RMAF-CGRR/rmafcgrr_e.asp
A Logic Model With Assumptions and ‘Factors’ Source: http://www.uwex.edu/ces/pdande/evaluation/evallogicmodel.html Retrieved November 14, 2008 from the University of Wisconsin-Extension website.
Program Model Components (Recap) OUTCOMES Short-Term Long-Term OUTPUTS INPUTS ACTIVITIES Resources placed into the program Core programtasks Products & services of the program Impact or effectiveness of the program Examples: • Money • Staff • Operational expenses • Capital assets Examples: Change in: • Knowledge/awareness • Skills • Attitude/opinions • Behaviour • Condition • Status • Morbidity, mortality Examples: • Teaching • Presentations • Counselling • Mentoring • Treatment Examples: • # materials distributed • # classes taught • # sessions conducted • # hours of service delivered ---------------------------------- • # of participants (reach) Source: Adapted from Measuring Program Outcomes: A Practical Approach. United Way of America, 1996.
Benefits of the Logic Model • Helps with understanding overall structure, function of program as well as rationale behind activities • Helps to ensure that program activities and intended results correspond • Helps identify key questions for the evaluation • Helps communicate the elements of the program to policy makers, staff, external funding agencies, media, and colleagues • Helps to reveal where steps in the program break down Source: Adapted from K. Farell et al., Evaluation made very easy, accessible, and logical, 2002.
Limitations of the Logic Model • Initially time consuming (days/weeks/months) • Requires patience • Does not always capture all aspects of the program (e.g., program costs may not be included in the model) • May not represent all external influences and factors Source: Adapted from K. Farell et al., Evaluation made very easy, accessible, and logical, 2002.
Characteristics Of Good Logic Models • Activities and outputs are distinct from outcomes; the general rule is that if you control it, it’s an activity/output, if you can only influence it, then it’s an outcome • Outputs demonstrate that you are busy • Outcomes have a distinct “who” and “what”, what change in whom? • Outcomes demonstrate that you are making a difference • Outcome statements are simply worded, contain only one outcome, and no “how’s” • The linkages between outputs and outcomes are clear • Outcomes are not tied to particular timeframes • No more than 2 or 3 final outcomes • Linked to strategic outcomes and program goals but reflect reality Sources: US GPRA Guidance 1999, Mayne (various), Montague Focusing on Inputs, Outputs and Outcomes, Canadian Journal of Program Evaluation, 2000
Outcome Examples Source: Patton, M.Q., “Utilization-Focused Evaluation: The New Century Text”, 1997.
Thinking About What to Include Where • Some program components are difficult to classify as activities, outputs, or outcomes. These examples provide general guidelines (although exceptions may be appropriate): • recruiting and training staff and volunteers, purchasing or upgrading equipment, and various support and maintenance activities are usually foundational (and not on a logic model) • number of participants served is sometimes an output, but if participation is discretionary, could be considered an early outcome • participant satisfaction is usually an early outcome
Where to Start? • There is no single way to create a logic model. Where you start often depends on the developmental stage of the program • Strive for simplicity and don’t be over-inclusive. Don’t include all the implementation details. Try to fit the whole logic model on one page. • Discuss the logic model with staff involved at all levels in the program (or involve them in a logic model development workshop) • Post-it notes are a great tool for logic model development Source: Adapted from Porteous, N.L. et al., Program Evaluation Tool Kit: A Blueprint for Public Health Management, 1997.
Small Group Exercise #1 • Educational grants program (grants provided to students for post-secondary education, targeting low-income population) • What would be some outputs? • What would be some immediate outcomes? • What would be some intermediate outcomes? • What would be some final outcomes?
Small Group Exercise #2 Building an Evaluation Framework Clarifying the Program’s Logic and Theory of Change The problem gambling needs assessment found that gambling has become a very important pastime for young adults aged 18-24 years. Analysis of Rockwood’s databases showed a steady increase in the number of young adults with gambling problems. Focus groups painted a bleak picture – although casinos, lotteries and mass media are aggressively marketing gambling to young adults, the message has not gotten out to young adults about the dangers of problem gambling and the importance of seeking prompt treatment. In fact, a recent study has found twice as many young adults aged 18 to 24 developed severe or moderate gambling problems as the overall population. Other findings, such as the fourfold rise between 2001 and 2005 of young adults now playing online poker, indicate this trend is likely to continue or increase. As one response, the Rockwood Program Planning Team decided to offer a Gambling Prevention Program for young adults. The prevention program intends to make young adults aware of dangerous gambling behaviour (such as skipping class or work to gamble) in themselves or their friends, help them to see gambling as a form of occasional entertainment rather than a glamorous and lucrative lifestyle, minimize serious financial problems, and encourage young adults with gambling problems to get help when necessary. Program activities include staging gambling awareness events in schools featuring celebrities, placing edgy public service announcements in the mass media, displaying posters in malls and on mass transit that discourage gambling, and having booths about problem gambling at health fairs and staffing them with trained peers who will provide advice in a non-threatening and non-judgmental way.
Small Group Exercise #2 • Using case study material: • Select a logic model template • Identify some key activities and outputs, immediate outcomes, intermediate outcomes and final outcomes • Present them in a logic model format • Spend a few minutes discussing what you found challenging when developing your logic model
SECTION 3. Performance Measurement Plan
Performance Measurement Plan • A performance measurement plan identifies: • What needs to be measured on an ongoing basis • How • How often, and • What is the cost of the performance measurement plan (where possible) • Use performance monitoring to produce yearly performance reports of program results for funders, boards, senior managers, staff, and public • Performance monitoring systems are only tools. When properly developed and used, they can reveal problems, point to solutions and are a check on the effectiveness of solutions once implemented • Performance measurement plans help organizations to avoid the tendency to concentrate on the things that are easiest to measure, such as “The number of people trained” (service process measure) rather than “The number of people with jobs” (outcome measure)
Performance Measurement Plan (2) • Performance indicators show whether an output was produced or a specific outcome was achieved (success) • Describes specific, observable, measurable characteristics or changes that represent achievement of an output or outcome • Can be quantitative or qualitative (mix of both is good) • Indicators include: • number/percent of ... • incidence of ... • proportion of … Source: Hatry, Harry P. (1999). Performance Measurement Getting Results. The Urban Institute Press, Washington, D.C.
Outcome Participants stop smoking Examples Of Indicators Smoking Cessation Program Indicators • Number and percent of participants who report that they have quit smoking by the end of the class • Number and percent of participants who have not relapsed 6 months after program completion Information and Referral Service • Outcome • Callers access services to which they are referred or about which they are given information • Indicators • Number and percentage of community agencies that report an increase in new participants who came to their agency as a result of a call to the information and referral line Source: Outcome Measurement: Showing Results in the Nonprofit Sector, United Way of America, 1999.
Examples Of Indicators (3) • Number and percent of newborns weighing at least 5.5 pounds and scoring 7 or above on APGAR scale • Number and percent of teen mothers who graduate from high school over a 4-year period • Percent of participants who recall content of brochure, posters, or presentations • Number of action plans developed by participants • Number and percent of participants who have not relapsed six months after program completion • Number and percent of participants who demonstrate increase in ability to read, write, and speak English by end of program • Number and percent of youth who return home • Number and percent of teen mothers using a recommended form of birth control • Number and percent of legislators who voted in support of your position before and after an advocacy campaign Source: Outcome Measurement: Showing Results in the Nonprofit Sector, United Way of America, 1999.
Selecting Indicators • Things to think about: • Useful to decision makers • Decisions to be based on results information • Understandable to everyone • Clearly defined • Measurable • Use proxy indicators when necessary • Obtain baseline data and set targets (where possible) • Involve stakeholders • Use quantitative and qualitative indicators as appropriate • Try to limit the number of indicators
Criteria For Good Performance Indicators • Relevance • Importance • Understandability • Program influence or control over the outcome • Feasibility • Cost of collecting the indicator data • Uniqueness • Manipulability • Comprehensiveness Source: Hatry, Harry P. (1999). Performance Measurement Getting Results. The Urban Institute Press, Washington, D.C.
Measurement Through Monitoring • A monitoring system is typically key for performance measurement • Key monitoring system steps • Step 1: Obtain Top-level Support • Step 2: Develop Logic Model • Step 3: Select Measures • Step 4: Decide When to Measure • Step 5: Select a Data Collection Method • Step 6: Implement the Plan • Step 7: Analyze Data • Step 8: Use Data
Strengths and Weaknesses ofMonitoring Systems • STRENGTHS • Provides information about process and key results • Easy to understand and use • Improves accountability for effective programs • Improves program management • Provides early warning about potential problems with achievement of objectives • Facilitates evaluation • WEAKNESSES • Depends on setting realistic and appropriate measures • Requires good grasp of client outcomes • Can be expensive and time-consuming to collect data and to maintain the system • Does not establish causal relationship between services and outcomes (Describes rather than explains) • Difficult to compare programs in different settings, since indicators provide little contextual information
Small Group Exercise #3 Gambling Education Program For each performance indicator listed have your group identify whether it is a PROCESS or OUTCOME indicator. Type of Indicator ProcessOutcome 1. Thirty students attend the gambling education workshops. _____ _____ 2. Six group workshops are conducted. _____ _____ 3. Students’ awareness of problem gambling increases. _____ _____ 4. Students behave in a way that reduces the risk of developing gambling problems. _____ _____ 5. Students participate in role plays and group discussions. _____ _____
Small Group Exercise #4 • Thinking about your logic model components for an educational grants for students program: • For the immediate, intermediate and final outcomes developed in the previous exercise, develop at least 1 indicator for each • Discuss how this information could be used • Spend a few minutes discussing what you found challenging about identifying indicators
Outcome Indicators Small Group Exercise #4 Worksheet Educational Grants Program
Small Group Exercise #5 • Using the case study material and your logic model: • For the immediate and intermediate outcomes developed in the previous exercise, develop at least one indicator for each outcome • Discuss how this information could be used • Spend a few minutes discussing what you found challenging about identifying indicators
Outcome Indicators Small Group Exercise #5 Worksheet Case
Performance Measurement Plan Source: Health Canada (2006) Results-based Management and Accountability Framework Assessment Guide
Section 4. Evaluation Plan
Evaluation Plan • The evaluation plan sets out a strategy for a periodic, in-depth look at how well a policy, program or initiative is doing • It identifies: • the key evaluation issues/questions that should be addressed • the key pieces of information that need to be collected to answer the evaluation questions • the data collection plan • potential costs for an evaluation • suggested timing for evaluation • reporting requirements • Builds on a performance measurement plan • adds context and depth to information being collected through ongoing performance measurement.
Evaluation Plan: Issues and Questions • Evaluation questions usually relate to 3 kinds of issues: • Relevance • Does the policy, program or initiative continue to be consistent with organizational priorities, and does it realistically address an actual need? • Success (Effectiveness) • Is the policy, program or initiative effective in meeting its intended outcomes, within budget and without unwanted negative outcomes? Is the policy, program or initiative making progress toward the achievement of the final outcomes? • Cost-effectiveness and alternatives • Are the most appropriate and efficient means being used to achieve outcomes, relative to alternative design and delivery approaches? • Evaluation also addresses design and delivery issues