Download
1 / 36
360 likes | 501 Vues
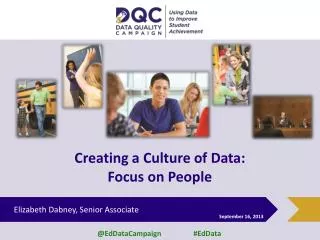
Creating a Culture of Data: Focus on People. Elizabeth Dabney , Senior Associate. September 16, 2013. What is the Data Quality Campaign?. A nonprofit, nonpartisan, national advocacy organization based in Washington, DC Launched in 2005

E N D
Creating a Culture of Data:Focus on People Elizabeth Dabney, Senior Associate September 16, 2013
What is the Data Quality Campaign? • A nonprofit, nonpartisan, national advocacy organization based in Washington, DC • Launched in 2005 • Committed to realizing the vision of an education system in which all stakeholders—from parents to policymakers—are empowered with high-quality data from the early childhood, K–12, postsecondary, and workforce systems to make decisions that ensure every student graduates high school prepared for success in college and the workplace • Supports state policymakers and other key leaders to promote the effective use of data to improve student achievement • Developed the 10 Essential Elements (development) and 10 State Actions (use)
How DQC Defines Data • We define data as: • More than test scores, including attendance and course-taking, as well as teacher and financial information • Any information stakeholders need to make decisions, which means more than state-level data • P–20W data that span early childhood through postsecondary and the workforce • We think the most useful data are: • Longitudinal: follow individual students over time and across systems and sectors • Actionable: timely, user friendly, and tailored to users • Contextual: robust, comparable, and presented as part of a bigger picture
How DQC Defines Effective Data Use: Continuous Improvement FUTURE: Continuous Improvement PRESENT: Accountability PAST: Compliance
How DQC Thinks Data Can Help Children Effective data use
Enabling Conditions to Foster a Culture of Effective Data Use
How Far Have States Come in Ensuring Effective Data Use? 42 states publicly posting at least two reports using aggregate longitudinal data 17 states publicly posting at least two reports using aggregate longitudinal data The average state had 4-5 of the 10 Essential Elements of Statewide Longitudinal Data Systems The average state had 9-10Elements, all states committed to build all 10 2007 2006 2008 2009 2010 2011 2012 2005 36 states using state funds for their P–20 data system 8 states using state funds for their P–20 data system
About Data for Action • DQC invites each state’s governor’s office to participate in the survey. The governor’s office can appoint a designee to respond to the survey in collaboration with stakeholders. • An online survey tool is used to collect self-reported information from each of the 50 states, DC, and Puerto Rico. • In part one of the survey, states answer a series of questions about each of the 10 State Actions. • In part two, states report on emerging data issues and promising practices in the field. • DQC determines whether or not states receive credit for each Action based on states’ responses. • States responded to the survey in summer 2012, reflecting the current status of their work at that time.
Data for Action: 10 State Actions to Support Effective Data Use • LINKING P–20W Data • Link P–20W data systems • Create stable, sustained support • Develop governance structures • Build data repositories • ENSURING DATA ACCESS • Provide timely data access • Create individual student progress reports • Create longitudinal reports BUILDING CAPACITY TO USE DATA Develop research agenda Build educator capacity Raise awareness of available data
But States Are Making Progress • All states have at least one Action, showing a commitment to working toward effective data use. • Twelve states gained two or more Actions, making strides in supporting effective data use (AK, DC, IN, KS, KY, LA, MD, NJ, NM, OR, VT, and WY). • Ten states have eight or nine of the Actions, a substantial increase from four states in 2011 (IN, LA, ME, NC, OH, and OR join AR, DE, FL, and TX).
Gaining, Maintaining, and Lagging Actions LAGGING GAINING GAINING MAINTAINING LAGGING GAINING GAINING MAINTAINING LAGGING MAINTAINING
Do These Results Ring True To You? What might be the reason(s) for Actions 5 and 9 lagging? Is this true in your state?
Drivers to Link ECE and K-12 Data • Linked, shared, and coordinated ECE and K-12 data are needed to inform decisionmaking at all levels, from parents to policymakers • Federal policies are accelerating state efforts • State advisory councils • Race to the Top Early Learning • Statewide Longitudinal Data Systems • National advocacy campaigns are advocating for ECE and K-12 linkages • Data Quality Campaign • Early Childhood Data Collaborative (ECDC)
Data for Action: 10 State Actions to Support Effective Data Use • LINKING P–20W Data • Link P–20W data systems • Create stable, sustained support • Develop governance structures • Build data repositories • ENSURING DATA ACCESS • Provide timely data access • Create individual student progress reports • Create longitudinal reports BUILDING CAPACITY TO USE DATA Develop research agenda Build educator capacity Raise awareness of available data
Linking P–20W Data KEY FINDING: States have laid the foundation to link P–20W data systems but lack governance structures with the authority necessary to share appropriate and limited critical data. This deficiency impedes their efforts to empower stakeholders with critical information to ensure positive outcomes for children and their families.
Key Question to Create a Culture of Data • Did the governance bodies start their data planning efforts with the most pressing questions from the state’s stakeholders? What are your most pressing questions?
State Spotlight: Illinois Illinois Learning Council Early Childhood Data Work Group Key Questions (2011) • Are children, birth to five in Illinois, receiving early care and education? What impact are those programs having? • Is the quality of programs improving? • How prepared is the early care and education workforce to provide effective education and care for all children? • What longitudinal information do we want to know about children enrolled in early learning programs over time? • How is data being used to align, prioritize, and mobilize resources?
Data for Action: 10 State Actions to Support Effective Data Use • LINKING P–20W Data • Link P–20W data systems • Create stable, sustained support • Develop governance structures • Build data repositories • ENSURING DATA ACCESS • Provide timely data access • Create individual student progress reports • Create longitudinal reports BUILDING CAPACITY TO USE DATA Develop research agenda Build educator capacity Raise awareness of available data
Ensuring Data Access KEY FINDING: States are producing reports and dashboards using longitudinal data but are lagging in ensuring data access by stakeholders such as parents. There is more work to do to meet all stakeholders’ needs.
Key Questions to Create a Culture of Data • Do reports meet stakeholder needs? • How can the state ensure that local stakeholders have access to the data they need? What data or reports would be most helpful to you?
State Spotlight: Kentucky’s 2013 Early Childhood Profile Reports • Aims to change the conversation in each community to achieve its goals • Every Kentucky child will enter school ready to succeed • Every parent will know what their child needs to be ready for school • Every community will come together in support of their youngest children • Provides each county with data to assist in developing local strategies • results from the kindergarten screener pilot which was launched in 109 districts in 2012 • information about participation in publicly funded preschool, Head Start, and child care • information about the quality and availability of child care and the education of the early childhood workforce • demographic data representing key indicators of possible barriers to success and participation in public health and social service programs that can help • Produced in partnership with the Kentucky Center for Education and Workforce Statistics, Kentucky Department of Education, and the Cabinet for Health and Family Services
Data for Action: 10 State Actions to Support Effective Data Use • LINKING P–20W Data • Link P–20W data systems • Create stable, sustained support • Develop governance structures • Build data repositories • ENSURING DATA ACCESS • Provide timely data access • Create individual student progress reports • Create longitudinal reports BUILDING CAPACITY TO USE DATA Develop research agenda Build educator capacity Raise awareness of available data
Building Capacity to Use Data KEY FINDING: States are increasingly providing training to help stakeholders use data but have not done enough to build the capacity of all education stakeholders to effectively use data.
Key Questions to Create a Culture of Data • What is the state doing to ensure enabling conditions to promote the use of data? What supports do you need to feel comfortable using data?
State Spotlight: Oregon DATA Project • Since 2007, the Oregon DATA Project has trained nearly 5,000 educators to use data to inform instructional decisions. • Using a grassroots approach, the Oregon DATA Project has invested in teachers and school leaders by granting technical access to student data and providing comprehensive, job-embedded training on how to use those data to make decisions in the classroom. • Oregon has documented teachers feeling more comfortable using data in the classroom, and the state has seen improved student achievement in schools participating in the Oregon DATA Project.
Additional Data for Action Resources Please visit www.DataQualityCampaign.org for: • National Analysis: National trends in states’ progress on building and using state longitudinal data systems to improve student achievement according to DQC’s 10 State Actions (http://www.dataqualitycampaign.org/your-states-progress/executive-summary/) • State-by-State Analysis: Individual state profiles and the ability to compare states to one another • Action Issues: Deeper analyses about states’ data capacity to support various education policies and practices such as teacher effectiveness, parent empowerment, college choice, early warning systems, and high school feedback
Questions? Elizabeth Dabney Senior Associate Data Quality Campaign edabney@dataqualitycampaign.org