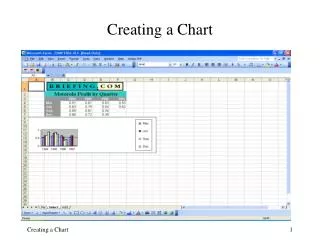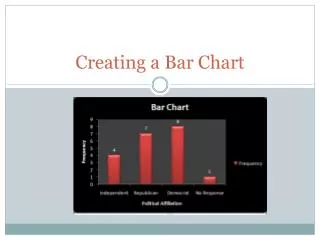
Creating a simple bar chart with error bars in SPSS
Creating a simple bar chart with error bars in SPSS. Independent / Between subjects. Independent data bar chart. Open SPSS Enter data Remember to use a grouping variable (e.g. Hand in this example; 0 – left handed, 1 – right handed) for an independent design. Independent data bar chart.

Creating a simple bar chart with error bars in SPSS
E N D
Presentation Transcript
Creating a simple bar chart with error bars in SPSS Independent / Between subjects
Independent data bar chart • Open SPSS • Enter data • Remember to use a grouping variable (e.g. Hand in this example; 0 – left handed, 1 – right handed) for an independent design
Independent data bar chart Choose GRAPHS – CHART BUILDER from menu bar The reminder on the right will pop up to remind you that you need to have correctly defined the properties of your variables (e.g. Measurement scale) Make sure that you have defined these correctly The grouping variable is a nominal variable type
Independent data bar chart • Drag the ‘simple bar’ chart type from the Gallery onto the Preview space
Independent data bar chart You can edit the names of the x and y axis if you want by clicking the axis in the ELEMENT PROPERTIES box and typing over the ‘Axis Label’
Independent data bar chart • Click and drag the grouping variable (IV - Handedness) to the x axis and the measurement variable (DV – Time to answer call) to the y axis
Independent data bar chart To add error bars: Click on Bar 1 in the Element Properties box Tick ‘Display error bars’ and select ‘Standard error’ setting the multiplier to 1 Your graph will now show the mean RT for the groups (mean RT for left and right handed telephone operators in this example)
Independent data bar chart Click OK on the Chart Builder window and you will be rewarded with a nice simple graph that you can copy and paste into your report You will need to give the graph a caption using APA style: e.g. Figure 1. Mean reaction times for left and right handed phone operators