BAR CHART
BAR CHART. Paweł Bilski Piotr Mazur Paulina Wawryca. Definition. Barchart – it is a chart with rectangular bars with lengths proportional to the values that they represent. Bar charts are used for comparing two or more values. The bars can be plotted vertically or horizontally. Examples.

BAR CHART
E N D
Presentation Transcript
BAR CHART Paweł Bilski Piotr Mazur Paulina Wawryca
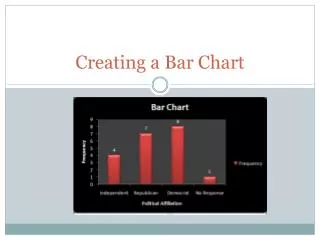
Definition Barchart – it is a chart with rectangular bars with lengths proportional to the values that they represent. Bar charts are used for comparing two or more values. The bars can be plotted vertically or horizontally.
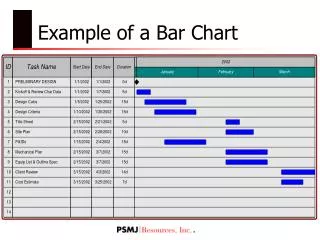
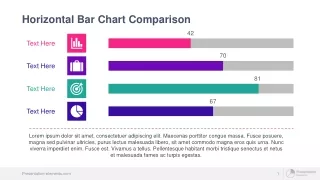
Examples Vertically Horizontally
Bar charts are familiar to most people, and interpreting them depends largely on what information you are looking for. You might look for:- the tallest bar.- the shortest bar.- growth or shrinking of the bars over time.- one bar relative to another.- change in bars representing the same category in different
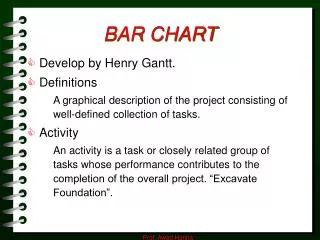
Gantt chart • Henry Laurence Gantt devised the Gantt chart in the 1910. • A Gantt chart is the most popular type of bar chart. • Is a graphical representation of the duration of tasks against the progression of time. • A Gantt chart is a useful tool for planning and scheduling projects. • It is helpful when monitoring a project’s progress.
Planning and scheduling • Use a Gantt chart to plan how long a project should take. • A Gantt chart lays out the order in which the tasks need to be carried out. • Early Gantt charts did not show dependencies between tasks but modern Gantt chart software provides this capability.
Monitoring a Project • A Gantt chart lets you see immediately what should have been achieved at any point in time. • A Gantt chart lets you see how remedial action may bring the project back on course. • Most Gantt charts include "milestones" which are technically not available on Gantt charts. However, for representing deadlines and other significant events, it is very useful to include this feature on a Gantt chart.
To create Gantt chartsareused: • CS Project Professional • Easyplane • Microsoft Project • Powerproject • Project Commander
Gantt chart is a matrix: • The Gantt chart is constructed with a horizontal axis representing the total time span of the project, broken down into increments (days, weeks, or months) and with a vertical axis representing the tasks that make up the project. • The Gantt chart is constructed with a graph area which contains horizontal bars for each task connecting the period start and period ending symbols.
The Gantt chart hasvariants: • Milestones: important checkpoints or interim goals for a project. • Resources: for team projects, it often helps to have an additional column containing numbers or initials which identify who on the team is responsible for the task. • Status: the projects progress, the chart is updated by filling in the task's bar to a length proportional to the amount of work that has been finished . • Dependencies: an essential concept that some activities are dependent on other activities being completed first.
Advantages of bar charts and linked bar charts • simple and easy to read • give a good picture on the data • applicable at all stages of the planning process • easily updated (for review purposes and progress reports) • clearly mimics the construction sequence - the use of linking between bars facilitates the overlapping of related operations
Disadvantages of bar charts and linked bar charts • Do not show dependency and do not clearly indicate which operations directly relate to the successful completion of the project. This makes it difficult to apply management by exception • Logical links are used to overcome this problem but these can become confusing and difficult to interpret on complex projects • Consequently, complex interrelationships cannot be clearly shown
Sources • B. Cooke, P. Williams „Construction planning, programming and control” Third Edition 2009 • http://www.skymark.com/resources/tools/bar_charts.asp • http://www.gantt-chart.biz