Download
1 / 1
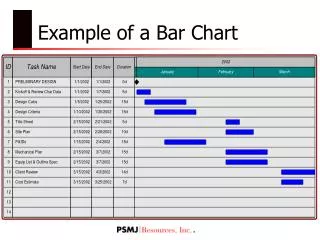
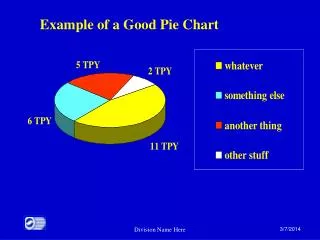
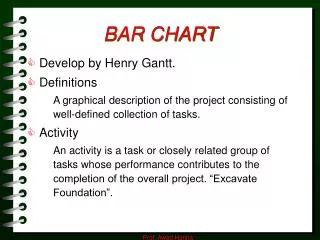
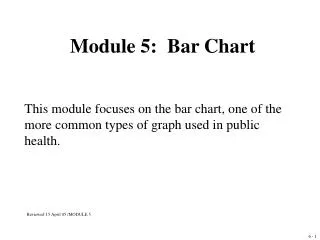
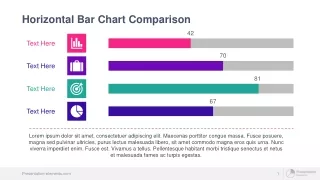
Understanding the Basics of Bar Charts: A Comprehensive Overview
10 likes | 140 Vues
This article explores the fundamentals of bar charts, a popular graphical representation used in statistics and data analysis. We discuss the various types of bar charts, including vertical and horizontal formats, and when to use them effectively. Learn about how to interpret bar charts, complement them with appropriate labels and colors, and the best practices for creating your own. Whether you're preparing a presentation or analyzing data trends, this guide will help you harness the power of bar charts.
Télécharger la présentation 
Understanding the Basics of Bar Charts: A Comprehensive Overview
An Image/Link below is provided (as is) to download presentation
Download Policy: Content on the Website is provided to you AS IS for your information and personal use and may not be sold / licensed / shared on other websites without getting consent from its author.
Content is provided to you AS IS for your information and personal use only.
Download presentation by click this link.
While downloading, if for some reason you are not able to download a presentation, the publisher may have deleted the file from their server.
During download, if you can't get a presentation, the file might be deleted by the publisher.
E N D


More Related