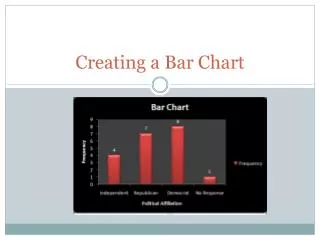
BAR CHART
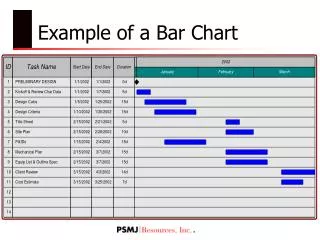
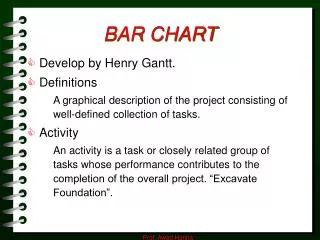
BAR CHART. Develop by Henry Gantt. Definitions A graphical description of the project consisting of well-defined collection of tasks. Activity

BAR CHART
E N D
Presentation Transcript
BAR CHART • Develop by Henry Gantt. • Definitions A graphical description of the project consisting of well-defined collection of tasks. • Activity An activity is a task or closely related group of tasks whose performance contributes to the completion of the overall project. “Excavate Foundation”. Prof. Awad Hanna
BAR CHARTS ORGANIZATION Item Activity M10 Mobilization Bars (Month or Year) Prof. Awad Hanna
CONSTRUCTION THE BAR CHART • When constructing a bar chart, the following questions must be answered: 1. What time units should be used? 2. Should work days or calendar days be used? 3. What about non continuous work? • Additional information may be added to the basic bar chart such as activity value, cost and resource requirements. Prof. Awad Hanna
TYPE OF BAR CHART Type I Linear time-scaled for planning, Linear progress-scaled for reporting • Assume the progress of the activity as a direct-linear function of the elapsed time. • For this example • Five months were originally scheduled for this activity. • Reporting date at 3rd month, 60% of the elapsed time. • Activity behind by 10% “May or may not be true”. Prof. Awad Hanna
Type I Bar Charts Jan Feb Mar Apr May (a) Type I Plan Bar Jan Feb Mar Apr May Reporting date (b) Type I Reporting: Version 1 Jan Feb Mar Apr May Reporting date (c) Type I Reporting: Version 2 Prof. Awad Hanna
TYPE OF BAR CHART (cont.) Type II Time scaled for planning - Time scaled for reporting. • Planned cumulative progress % are written at the end of each time interval. • No linearity • the reporting bar gives no implication about the actual progress. Prof. Awad Hanna
Type II Bar Charts Jan Feb Mar Apr May Scheduled program 0 10 30 50 80 100 Original schedule (a) Type II Plan Bar Jan Feb Mar Apr May 0 10 30 50 80 100 Actual Time Work Actual Progress 0 8 28 55 Reporting date (b) Type II Reporting: Case 1 Jan Feb Mar Apr May Jun Jul 0 10 30 50 80 100 75 90 96 0 8 28 55 Reporting date (b) Type II Reporting: Case 2 Prof. Awad Hanna
BAR CHARTADVANTAGES AND DISADVANTAGES • Advantages • Easy to prepare • Easily understood by all parties • It shows the total plan in impact form. • Good communication tool • Disadvantages • Do not show interrelationships between activities • Managing projects becomes difficult without those relationships between activities • It is difficult to judge the impact of an unexpected event on the rest of the construction process Prof. Awad Hanna