Foundation B Question 6 tally chart; bar chart Question 7 interpret pie chart
90 likes | 282 Vues
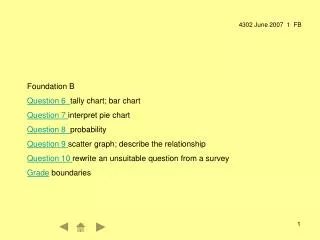
Foundation B Question 6 tally chart; bar chart Question 7 interpret pie chart Question 8 probability Question 9 scatter graph; describe the relationship Question 10 rewrite an unsuitable question from a survey Grade boundaries.

Foundation B Question 6 tally chart; bar chart Question 7 interpret pie chart
E N D
Presentation Transcript
Foundation B Question 6 tally chart; bar chart Question 7 interpret pie chart Question 8 probability Question 9 scatter graph; describe the relationship Question 10 rewrite an unsuitable question from a survey Grade boundaries
6. The items bought one day from a vending machine are recorded in the tally chart. (a) Complete the frequency column 20 22 13 5 1 mark (b) Draw a bar chart of this data on the grid below
25 20 15 10 5 0 3 marks C W M O (c) How many items were bought altogether? 20 + 22 + 13 + 5 = 60 Answer: 60 1 mark
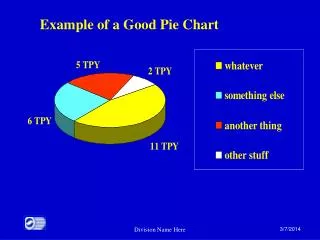
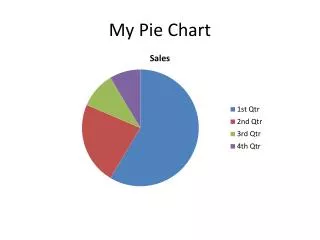
7. The pie chart shows the number of each type of fish that Frank caught in one day. pike eels perch roach True False Cannot say (a) Tick one box for each statement (i) Half the fish caught were roach (ii) There were more eels caught than pike (iii) The pike weighed more than all of the roach 3 marks
7 (b) Frank caught 30 fish altogether One-third of the fish caught were perch How many eels and pike were caught altogether? pike eels perch roach Half the fish were roach ½ of 30 is 15 One-third of the fish were perch 1/3 of 30 is 10 10 + 15 = 25, so the five fish left must be eels and pike Answer : 5 3 marks
8. A bag contains 6 toffees, 4 chocolates and 5 chews One sweet is chosen at random from the bag Write down the probability that the chosen sweet is (a) a toffee 6 toffees, 15 sweets 2 marks (b) a chew or a toffee 11 chews and toffees, 15 sweets 2 marks
9 The distance and cost of various flights is shown in the table cost (£) (a) Plot the data as a scatter graph 2 marks (b) Describe the relationship shown by your scatter graph The longer the flight, the higher the cost 1 mark Distance (miles)
10 Joe carries out a survey about fast foods This is one of his questions Do you agree that eating fast foods is unhealthy? This question is not suitable Rewrite the question so that it is suitable Include response boxes What is your opinion on this statement? Tick the box that matches it Eating fast foods is unhealthy 2 marks