Pie Chart Web Quest
110 likes | 594 Vues
Pie Chart Web Quest. Jennifer Bernard EDU 505. Introduction. You are a scientist at a research corporation who is in charge of collecting and analyzing data for different projects. For your next endeavor you will be choosing an area of interest in which to collect and evaluate data. . Task.

Pie Chart Web Quest
E N D
Presentation Transcript
Pie Chart Web Quest Jennifer Bernard EDU 505
Introduction You are a scientist at a research corporation who is in charge of collecting and analyzing data for different projects. For your next endeavor you will be choosing an area of interest in which to collect and evaluate data.
Task Your assignment is to collect data over the course of the next week and use the data to create a pie graph. You will then use the pie graph to draw conclusions. At the end of the week each research group will present their findings to the class through the use of a pie chart.
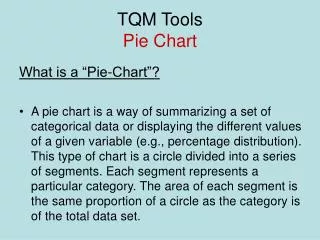
Process and Resources • Use the following links to get information on what a pie chart is, what type of data is used in a pie chart, and how to make a pie chart. Pie charts are also called circle graphs. I recommend visiting at least the first three links. An overview of pie charts. How to read a pie chart. How to create a pie chart Practice making pie charts. More examples of pie charts. Pie charts on Microsoft Excel. 2. Determine what type of data you are going to collect, remember you need to find data where you are comparing a part to the whole. For example: the number of each color of m&m’s there are in a king size bag of m&m’s. Or how many people like each type of fruit the best: mango, banana, pineapple, pear, or grapes.
Process 3. Practice making a pie chart in the link Practice making pie charts. Make sure your idea will work by making up hypothetical data and making a practice pie chart. 4. You and your co-researcher will use the next week to collect data. You need: • at least 5 categories (i.e. 5 types of fruit.) and no more than 10 categories. • at least 36 pieces of data (i.e. ask 36 people what their favorite fruit is.) • A way to keep your data organized (consider using a chart) • A time management plan (pick a research area and start collecting data ASAP)
Process 5. Once your data is collected you will need to create a pie chart. Make sure you use the information in the links provided in order to create an accurate pie chart. You must label the following: • Title of the graph • Categories • Amount in each category • Percentage of the whole for each category. You may make your pie chart by hand or on the computer, it is up to you. 6. You will create a poster; on the poster you need to • explain how you collected the data, • explain how you used the data to create the pie graph, • discuss any findings you think are interesting, • have a pie chart that you found in a newspaper, magazine, etc. and be able to explain what it is showing, • and of course your pie chart. 7. Make sure you and your co-researcher work together, you will visit links together, collect data together, create the poster together, and present together. Good luck on your research!
Conclusion In a week and one day you will present your findings to the class with the help of your poster. You will need to explain how you created your pie chart, how to read your pie chart, what the pie chart you found in the paper/magazine says, as well as be able to answer questions that your fellow researchers may ask.
Teacher Page • This Web Quest is designed for seventh grade students. • Allot one weeks time for this web quests. However, only 3 80 minute periods need to be allocated for the web quest. One in the beginning for students to become familiar with the assignments, and two at the end where students work on their posters and share their findings. • The following New York State Standards are covered in this web quest: • 7.S.1 Identify and collect data using a variety of methods • 7.S.2 Display data in a circle graph • 7.S.6 Read and interpret data represented graphically (pictograph, bar graph, histogram, line graph, double line/bar graphs or circle graph)
Bibliography • http://www.mathleague.com/help/data/data.htm#piecharts • http://cstl.syr.edu/FIPSE/TabBar/ReadCirc/REVCIRCL.HTM • http://cstl.syr.edu/fipse/TabBar/BldCirc/BUILDCIR.HTM • http://nces.ed.gov/nceskids/createagraph/ • http://socrates.bmcc.cuny.edu/cpe/pie.html • http://pubs.logicalexpressions.com/Pub0009/LPMArticle.asp?ID=390 1/15/2008