Describing Pie Chart
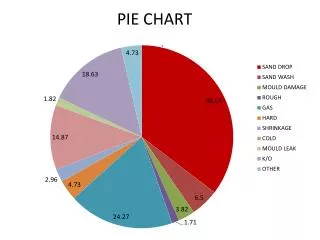
Describing Pie Chart. Describing one part of the chart. Starting with the adjective:. Starting with Adjective The highest percentage of time spent on internet was on viewing content. The smallest proportion of total time spent on internet was for social networking.

Describing Pie Chart
E N D
Presentation Transcript
Starting with Adjective • The highest percentage of time spent on internet was on viewing content. • The smallest proportion of total time spent on internet was for social networking.
The highest proportion of expenditures in 1960 was for housing. • The least prevalent expenditures in 1960 was for child care and education.
Starting with Subject • Viewing content on the internet was the most common in terms of the time spent. • Users spent most of their time viewing content on the internet. • Internet users spent the least prevalent time on social networking.
In 1960, expenditures on housing was the most common. • Expenditures on clothing was the least prevalent in 2009 which was only 6%.
As many as 31% expenditures were spent on housing than to child care and education in 1960. • Substantially more expenditures were spent on transportation in 1960 compared to 2009.
There were considerably more people came from Asia than the other continent in the world. • There were twice as many consumption of resources came from USA and Europe compared to the other countries.
The expenditure on housing in 1960 was as prevalent as it was in 2009. • The expenditure on food in 2009 was fractionally more than it was in 1960.
The two graphs show the main sources of energy in the USA in the 1980s and the 1990s. Summarize the information by choosing and describe the main idea, and make comparisons where appropriate. Write at least 150 words.
Summarize the information by choosing and describe the main idea, and make comparisons where appropriate. You should write at least 150 words.