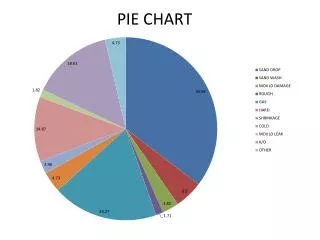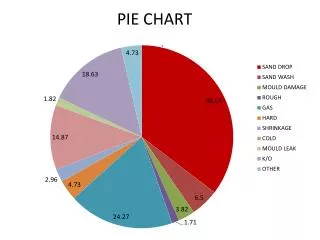
Creating a Pie Chart for Your Reservoirs
30 likes | 196 Vues
Creating a Pie Chart for Your Reservoirs. Yesterday, you were to have “traveled” to 20 different reservoirs….. This should have left you with 20 beads on your pipe cleaner. You should have the number of each color bead you have gathered on the back of your paper.

Creating a Pie Chart for Your Reservoirs
E N D
Presentation Transcript
Yesterday, you were to have “traveled” to 20 different reservoirs….. • This should have left you with 20 beads on your pipe cleaner. • You should have the number of each color bead you have gathered on the back of your paper. • You will use this information to create your pie graph…
Create A Title • Pick One Color Bead • Count 2 • spaces • for each • bead • Color • those • spaces • with • the • appropriate • color • Pick • another • color and • repeat • step 2 • 4. Continue • until you • have graphed • each color.