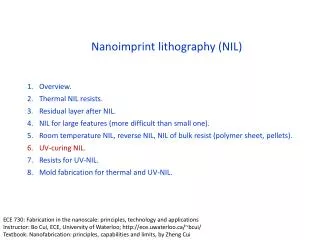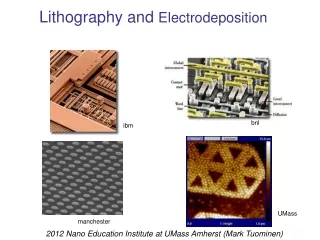
Lithography
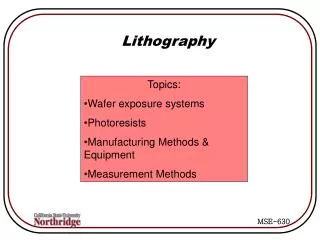
Lithography. Topics: Wafer exposure systems Photoresists Manufacturing Methods & Equipment Measurement Methods. Projected Lithography Requirements. Projection systems. Proximity Printing : Mask/wafer separated 5-25 m m Separation results in poor resolution

Lithography
E N D
Presentation Transcript
Lithography • Topics: • Wafer exposure systems • Photoresists • Manufacturing Methods & Equipment • Measurement Methods
Projection systems • Proximity Printing: • Mask/wafer separated 5-25 mm • Separation results in poor resolution • Limited to mm-sized features • Both systems require 1X masks • Contact Printing: • Limited diffraction effects • Inexpensive • Contact between mask & resist results in damage – low yield • Oldest & simplest
Projection systems • Produce high resolution w/o defects • Resolution limited by diffraction effects • Mask is 4X – 5X image size • Sub-micron features • 50 wafer/hour throughput
Diffraction effects Light passing through aperture, with an opening ≈l, diffracts, creating a larger image than that on the mask Light travels as a plane wave in free space. The spherical wavelets combine to for a uniform front. When it passes through an aperture, the waves from the limited number of wavelets superimpose, spreading out in all directions. Smaller openings mean greater diffraction
The light that diffracts at the highest angels carries detailed information about the shape of the aperture, is not collected passing through the focusing lens and is lost. Projected intensity of light through a circular aperture. Rings around center bright spot result from diffraction D = diameter of central disk f = focal length d = objective lens diameter
A Fourier series is used to describe the path of light: The intensity is given by: I(fx,fy) = |e(fx,fy)|2 = |F[t(x1,y1)]|2
Depth of Field The Rayleigh criteria for depth of focus states that the path difference for a ray on the center line and one coming from the edge of the aperture should not differ by more than l/4.
Example Estimate the resolution and depth of focus of an excimer laser stepper using KrF light source (l = 248 nm) and NA=0.6 Assume k1 = 0.75 and k2 = 0.5. Solution: R = k1*l/NA = 0.75(0.248/0.6) = 0.31 nm DOF = ± k2*l/NA2 = ±0.5(0.248/(0.6)2) = ±0.34 mm
Modulation Transfer Function (MTF) The MTF is a measure of the quality of contrast between features. As features move closer together, diffraction affects cause their Airy disks to begin to overlap, changing the degree of intensity between the two features. Generally, a MTF>0.5 is needed. Smaller values limit the minimum feature size
Aerial images produced by contact printing (dashed line) proximity, and projection systems. g=0 in contact system and ~25 microns in proximity system. The quality of the image decreases as the mask is removed from the surface, with gap size g. The image can be calculated when the gap falls between l < g < W2/2where W = mask opening width The minimum resolvable feature size is: Wmin≈ √(lg)
Simulated aerial image. Shading corresponds to optical intensity in the aerial image. The black borders correspond to the mask image that is being printed. The exposure system simulated has an NA = 0.43, partially coherent g-line (l = 436nm). Min feature size is 1 mm. Below: Same example, but wavelength has been reduced to 0.365 nm and NA has been increased to 0.5. Note improvement in image quality Left: same example as above except feature size has been reduced to 0.5 mm. Note the much poorer image quality
Light Coherency A perfect point source creates parallel beams after passing through the condensor lens. A light source with finite size causes light to strike mask at a variety of angles Coherent Partially Coherent A definition of spatial coherence of light sources is: S = light source diameter/condenser lens diameter = s/d Or S = NAcondenser optics/NA projection optics As s becomes more incoherent, MTF degrades for larger features but improves for smaller ones.
Photoresists • Resist changes chemical properties when exposed to light • Resist may be positive or negative. In positive resists, the exposed areas dissolve when developed • Resist is poured on to wafer, then wafer is spun. Viscosity is controlled by solvents, which evaporate • Following patterning and developing, resist is baked to increase hardness Typical process for g-line and i-line resists
Photoresists Sensitivity is a measure of the light required to expose a resist. In Deep UV resists (DUV), this is 20-40 mJ/cm-2.Lower sensitivity gives higher contrast and increased processing latitude. The above diagram illustrates how diazoquinone changes when exposed to light. The final molecule (bottom left) is carboxylic acid, which is soluble in common developers (e.g., KOH, NaOH, TMAH (tetramethyl ammonium hydroxide)) Basic structure of diazoquinone, a photo active compound (PAC) in positive resists
As wavelengths get shorter, photoresist has to be reformulated to have the desired reactivity and sensitivity In DUV resists, incoming photons react with a photo-acid generator (PAG) molecule, creating an acid molecule that acts as a catalyst to make resist molecule soluble. This process can repeat tens or hundreds of times during the post-exposure bake (PEB). Sensitivity of these resists is ~ 20-40 mJ/cm-2 This scheme is being exploited in a new generation of resists designed to work at short wavelengths.
Properties and Characterization of Resists Resist is characterized by its contrast and critical modulation transfer function (CMTF) Contrast is its ability to distinguish light from dark areas in the aerial image Resists with high contrast can sharpen a poor aerial image Idealized contrast curves for positive and negative resists Qo = dose at which exposure begins to have an effect Qf = dose at which exposure is complete
The MTF was used to measure the “dark” versus “light” intensities in the aerial image. A similar quantity is used for the resist, called the Critical MTF. It is the minimum optical transfer function needed to resolve a pattern in the resist. Example of how the quality of the aerial image and the resist contrast combine to produce the resist edge profile. The left side shows a sharp aerial image and steep resist edges. The example on the right shows a poorer aerial image and the resulting gradual edges on the resist profile.
Resist Exposure Issues • Resist coatings are: • Non-uniform thickness • Not exposed simultaneously • Light absorption falls off exponentially with increasing depth:I = Ioexp(-az) Highly reflective substrates create standing waves that systematically over/underexpose resist, resulting in “wavy” lines:
Mask Engineering: Optical Proximity Correction Because high frequency detail is lost due to diffraction defects and apertures and lenses are round, square details on mask are lost on aerial image (left). OPC adjusts the image on the right to provide greater detail in the projected pattern
Mask Engineering: Phase Shifting In the image at left, diffraction effects result in a loss of contrast where the waves overlap. On the right, a material is added to the mask to cause the light to shift phase 180o, thereby canceling the effect of overlap. Phase shifting can be used to improve the quality of the aerial image or to improve the depth of focus of the exposure system at constant resolution by using a lower NA system
Wafer Exposure Systems The schematic at left illustrates a scanning system for transferring information to the wafer. This requires a 1X mask. Modern systems use a 5X (or larger mask) and combine scanning with a stepper to systematically cover small portions of the wafer.
Techniques to improve image quality In the Kohler illumination system (left), light is focused at the entrance pupil of the projection lens, which captures the diffracted light from any features on the mask equally well Off-axis illumination captures some of the higher-order diffracted light which was lost in the normal illumination process
Measurement Methods Mask inspection measurements read the mask and compare it to another mask or a mask in a design database • Typical mask flaws include: • Opaque defects: Cr where it should not be • Clear defects: Cr isn’t where it should be • The actual size of the feature on the mask, which is influenced by the size of the e-beam spot used to write the mask (typ. ~0.125 mm) • Proximity effects from electron backscattering in the resist resulting in distortion
Test Structures This is an example of a typical test structure built into the edges of a chip/sheet. It is used to extract the sheet resistance The geometry is chosen to define one square of the material (labeled rs) A current, I5-6 is applied, and voltage, V3-4, is read at terminals 3 & 4. The sheet resistance is then: Given the sheet resistance, the line width can be calculated from: