Download

1 / 45
780 likes | 2.76k Vues
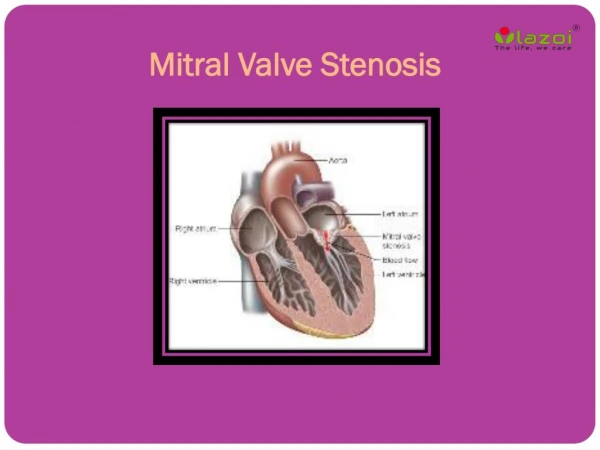
ECHOCARDIOGRAPHIC EVALUATION OF MITRAL STENOSIS. Dr Binjo J Vazhappilly Senior Resident. Mitral Valve Structure. Causes of MS. Rheumatic Degenerative Congenital MS Other: Systemic lupus , Infiltrative disease, Carcinoid heart disease , Drug-induced.

E N D
ECHOCARDIOGRAPHIC EVALUATION OF MITRAL STENOSIS Dr Binjo J Vazhappilly Senior Resident
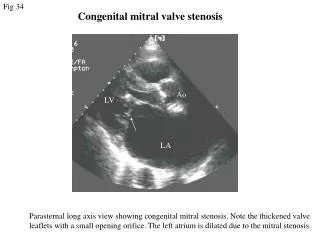
Causes of MS • Rheumatic • Degenerative • Congenital MS • Other: Systemic lupus , Infiltrative disease, Carcinoid heart disease , Drug-induced.
Anatomical Features • Rheumatic Commissural fusion Leaflet thickening Chordal shortening and fusion Superimposed calcification. • Degenerative Annular calcification. Rarely leaflet thickening & calcification at base.
Congenital Subvalvular apparatus abnormalities. • Systemic lupus , Carcinoid & Drug induced Leaflet thickening & restriction are common here. Commissures are rarely fused.
2D ECHO • Normally anterior & posterior leaflets open with maximal excursion at leaflet tips. • In rheumatic MS there will be doming motion of AML with restriction of motion at tips – Hockey Stick appearance. • Convert mitral apparatus from tubular channel to a funnel-shaped orifice.
2D ECHO • Commissural fusion Assessed in PSAX view Rheumatic etiology Complete fusion - severe MS. • Leaflet thickening Asssessed in PLAX • Chordal thickening & fusion in PLAX , Apical 4 Chamber views
M Mode ECHO • Increased echogenicity of leaflets. • Decreased excursion & reduced separation of anterior and posterior leaflets. • Reduced diastolic E-F slope of mitral closure Normal EF slope is > 60mm/sec If < 10 mm/sec indicate severe MS
TEE • Gives higher resolution view of mitral apparatus • Better to assess LAA thrombus • Midesophageal views assist in evaluating extent of disease. • Transgastric long-axis imaging plane provides best information about extent of subvalvular involvement.
Assessment of Mitral Stenosis Severity Level 1 Recommendations: Pressure gradient. MVA Planimetry. Pressure half-time. Level 2 Recommendations: Continuity equation. Proximal isovelocity surface area (PISA). Stress echocardiography. EAE/ASE RECOMMENDATIONS
Pressure gradient • Estimation of diastolic pressure gradient is based on simplified Bernoulli equation ∆P = 4V2 • Estimation has good correlation with invasive measurement using transseptal catheterization • Gradient is measured in the apical window. • Continuous wave doppler is preferred. • Color doppler is used to identify eccentric mitral jets.
Pressure gradient • Maximal & mean gradient are calculated. • Mean gradient is relevant hemodynamic finding. • Maximal gradient is derived from peak mitral velocity, which is influenced by left atrial compliance & LV diastolic function. • In AF : Avg of 5 cycles with least variation of R-R interval . • HR at which gradients are obtained to be noted.
Pressure gradient • Not the best marker of severity of MS. • Depend on heart rate, cardiac output(CO) & associated MR. • Tachycardia, increased CO & associated MR overestimates gradient.
Pressure Gradients varies with HR HR=72 HR=100
MVA by Planimetry • Planimetry is considered as reference measurement of MVA. • Direct tracing of mitral orifice including opened commissures in PSAX view at mid-diastole. • CSA is measured at the leaflet tips.
MVA by Planimetry • Gain setting should be just sufficient to visualize the contour of the mitral orifice. • Excessive gain setting may cause underestimation of valve area. • 3D echo imaging improves reproducibility and accuracy of planimetry measurement.
Unicommissural opening Both commissures are fused Bicommissural opening
Advantages of planimetry • Direct measurement of MVA. • Does not depend on flow conditions, cardiac chamber compliance or associated valvular lesions. • Best correlation with anatomic valve area of explanted valves. Disadvantage • Not feasible in poor acoustic window and severe valve calcification.
Pressure half-time (PHT) • PHT is defined as time interval in msec between maximum mitral gradient in early diastole & time point where the gradient is half the maximum initial value. • Decline of the velocity of diastolic transmitral blood flow is inversely proportional to valve area. • MVA is derived using the empirical formula MVA = 220/PHT
Pressure half-time • In addition to MVA , PHT depends on net compliance of LA & LV and square root of maximum transmitral gradient . • PHT obtained by tracing the deceleration slope of E-wave on Doppler spectral display of transmitral flow.
Measuring T1/2 with a bimodal slope of E-wave Deceleration slope in mid-diastole rather than early to be traced
MS with AF pts Tracing should avoid mitral flow from short diastoles and average of different cardiac cycles to be taken
Factors affecting PHT LA pressure decline • ASD : LA draining to second chamber. • Stiff LA – low LA compliance LA pressure drop rapidly and PHT is shortened. LV pressure rise • AR : LV fills from a second source . • Stiff LV (stiff-low ventricular compliance) LV pressure may rise more rapidly and PHT will be shortened. All these results in overestimation of MVA
PHT after BMV • PHT is inaccurate soon after acute valvotomy. • Usually increase in mean gradient is compensated by decrease in compliance. • Immediately after BMV there is discrepancy between decrease in mitral gradient and increase in net compliance.
Continuity equation • Continuity equation is based on the conservation of mass. • Filling volume of diastolic mitral flow is equal to aortic SV. • MVA = pD2X VTI aortic 4 VTI mitral D - diameter of the LVOT (cm) VTI – Velocity Time Integral (cm) • SV can also be estimated from the pulmonary artery.
Disadvantages • Needs multiple measurements and increased chance for errors. • Cannot be used in AF or associated significant MR or AR.
Proximal Isovelocity Surface Area (PISA) • Diastolic mitral flow converges on atrial side of stenotic mitral valve producing multiple shells of isovelocity hemispheres. MVA = 2pr2 x AV x a MV180 r : radius of convergence hemisphere (cm) AV : aliasing velocity (in cm/s) MV : peak Mitral velocity (cm/s) : opening angle of mitral leaflets relative to flow direction.
Steps in calculating MVA by PISA • Zoom the area of the mitral valve from the apical four-chamber view. • Use colour flow imaging of mitral stenosis jet and adjust aliasing velocity to 30 to 45 cm/s. • Freeze colour flow images in a cine loop and identify an optimal frame to measure radius (r) of PISA in LA. • Determine the angle (a) between two mitral leaflets at atrial surface and calculate MVA using the formula. • Using fixed angle value of 100° can be used in pts with MS.
PISA Advantages. • Can be used in presence of significant MR , AR & differing heart rhythms • Not affected by LA or LV compliance. Disadvantage. • Technical difficulty.
STRESS ECHOCARDIOGRAPHY • Unmask symptoms in asymptomatic patients with MVA<1.5cm2 • Semi-supine echocardiography exercise is now preferred to post exercise echocardiography (30 to 60 secs of leg lifts) • Semi-supine position allows monitoring in each step of increasing workload. • Mean mitral gradient & PASP are assessed during exercise.
STRESS ECHOCARDIOGRAPHY • Mean gradient > 15 mm Hg with exercise is considered as severe MS. • PASP > 60 mmHg on exercise is an indication for intervention. • Dobutamine stress echo mean gradient >18 mm Hg with exercise is considered as severe MS.
Mitral leaflet separation (MLS) index • Distance b/w tips of mitral leaflets in PLAX & four-chamber view in diastole. • Value < 0.8 cm predict severe mitral stenosis. • Value > 1.1 to 1.2 cm indicate mild MS.
Severity of MS • The normal adult MVA is 4 to 6 cm².
Assessment of mitral valve anatomy by Wilkins score • Important for choice of intervention. • Parameters assessed are valve mobility , thickening , calcification , subvalvular pathology. • Each parameter given score 1 to 4. • Total score is sum of four individual scores. • Score ≤ 8 are excellent candidates for BMV. • Score ≥ 12 are less likely to have satisfactory result.
Wilkins score Wilkins et al. Br Heart J 1988;60:299-308
Cormier score Cormier et al. Arch MalCoeur1989;82:185-91
Secondary features of MS • Mainly due to elevated LA pressure. • LA and LA appendage dilation occurs. • Increased chance for thrombus formation due to blood stasis. • Dilated RA ,RV and paradoxical septal motion may be seen due to pulmonary hypertension.
3D Echo • Has higher accuracy than 2D echo. • Gives better information of commissural fusion & subvalvular involvement. • MVA 3D measurements were slightly lower than similar measurements by transthoracic 2D imaging (mean difference - 0.16) & MVA by pressure half-time (mean difference-0.23) Schlosshan et al