Download
1 / 51
520 likes | 753 Vues
Cortical microcircuit (~1mm 3 ) -Structure: Cell types Connections Random Specific Canonical Areal/Species -Function: Feedforward Feedback. Calcium imaging of cortical microcircuits. Neuron. 1991 Mar;6(3):333-44.

E N D
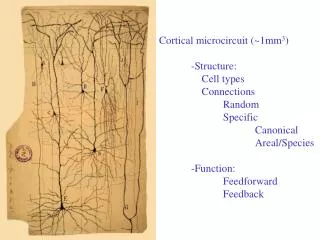
Cortical microcircuit (~1mm3) -Structure: Cell types Connections Random Specific Canonical Areal/Species -Function: Feedforward Feedback
Neuron. 1991 Mar;6(3):333-44. Control of postsynaptic Ca2+ influx in developing neocortex by excitatory and inhibitory neurotransmitters. Yuste R, Katz LC. Laboratory of Neurobiology, Rockefeller University, New York, New York 10021. We assessed the pathways by which excitatory and inhibitory neurotransmitters elicit postsynaptic changes in [Ca2+]i in brain slices of developing rat and cat neocortex, using fura 2. Glutamate, NMDA, and quisqualate transiently elevated [Ca2%]i in all neurons. While the quisqualate response relied exclusively on voltage-gated Ca2+ channels, almost all of the NMDA-induced Ca2+ influx was via the NMDA ionophore itself, rather than through voltage-gated Ca2+ channels. Glutamate itself altered [Ca2+]i almost exclusively via the NMDA receptor. Furthermore, synaptically induced Ca2+ entry relied almost completely on NMDA receptor activation, even with low-frequency stimulation. The inhibitory neurotransmitter GABA also increased [Ca2+]i, probably via voltage-sensitive Ca2+ channels, whereas the neuromodulator acetylcholine caused Ca2+ release from intracellular stores via a muscarinic receptor. Low concentrations of these agonists produced nonperiodic [Ca2+]i oscillations, which were temporally correlated in neighbouring cells.Optical recording with Ca2(+)-sensitive indicators may thus permit the visualization of functional networks in developing cortical circuits.
Cortical microcircuit (~1mm3) -Structure: Cell types Connections Random Specific Canonical Areal/Species -Function: Feedforward Feedback
Function of dendritic spines Most excitatory contacts on spines Some contacts on dendritic shafts Plenty of space on shaft Spines must be key for microcircuit More and longer spines in humans! What is the specific function of the spine?
50 µm 5 µm Imaging living dendritic spines with two-photon microscopy
What is the function of the spine?: -connect increase surface,volume shorten wire -chemical isolation learning rules/plasticity but non spiny cells too -electrical? amplification? filtering? digitization? no effect? Need to image voltage in spines!
Second Harmonic Generation (SHG) SHG, 2 Fundamental, Bulk Medium 1 *oriented Bulk Medium 2 *not oriented • A Second-order nonlinear scattering • Unique Properties of SHG • Interface specific : Centrosymmetric, e.g. bulk liquid (2) = 0; Non-centrosymmetric, e.g. surface, (2) ≠ 0. • Spectroscopic: resonance enhancement • Ultrafast time resolution SH response is instantaneous
Summary of Nonlinear Optical Phenomena P – Induced polarization in the medium E – Electric field vector of the incident light. c(n) – nth order electric susceptibility. Normal absorption, reflection, refraction SHG, sum and difference frequency generation, linear electro-optic (Pockels) effect, optical rectification, EFISH. Two and Three photon absorption, THG, EFISH, quadratic electro-optic effect, optical Kerr effect, degenerate four wave mixing (DFWM), Self Action (self focusing, self phase modulation), coherent Raman effects (Raman induced Kerr effect, coherent Stokes-Raman scattering (CSRS), coherent anti-Stokes-Raman scattering (CARS))
Second Harmonic Generation (SHG) Introduction • SHG is purely a scattering process, does NOT involve absorption of photons • SHG is coherent process in nature • SHG can be enhanced when the energy is near transition resonance
SHG Two-photon Why SHG? • Surface Selective • Electric Field Dependent 2eff= 2+ 3 EDC Electrical field change across plasma membrane when cell fires: ~ 108 V/m !! Ideal technique for optical imaging of membrane voltage (or membrane biochemistry)
Ti-Sapphire laser Pockels cell polarizer beam expander (1.2x) and spatial filter Fluoview data acquisition Ch 1 Ch 2 TPEF PMT pinhole SHG PMT Scan box lamp Retardation wave plate (l/2 and/or l/4)
Ti-Sapphire laser Lock-in Amplifier Function generator Pockels cell EO driver polarizer Fluoview data acquisition beam expander (1.2x) and spatial filter Ch 1 Ch 2 TPEF PMT pinhole SHG PMT Scan box lamp Retardation wave plate (l/2 and/or l/4)
Retinal chemical structure and absorption spectra Biochemistry, Stryer
SHRIMP- Second harmonic retinal imaging of membrane potential all-trans retinal
Circularly polarized light C293 cells TPEF SHG
SHG of hippocampal neurons (all-trans retinal) Z scan 1mm step
SHG depends on chromophore orientation N=5 Neuron Order parameter:
SHG depends on chromophore orientation Emitted light’s different polarization components can be isolated: • FM 4-64 insert into the membrane with an average angle of ~35o
Composite TPEF (green) SHG (Blue) Linearly polarized light C293+ kidneycells
Circularly polarized light C293+ kidneycells
Chromophore angle does not depend on membrane potential Same cell N=3
Imaging somatic action potentials: SHG is as fast as measurements
35min (10x, Z) 50min (3x, Z) 5mm 20mm 5mm Measurements of SHG from Dendritic Spines
p=0.8 (t-test) Normalized SHG Change (%) Soma (n=6) Spine (n=7) SHG Changes in Spines by Action Potentials SOMA Spines Voltage Change (Soma) SHG Change (Soma) Voltage Change (Soma) SHG Change (Spine) (n=6) (n=6)
7% 14% 22% 14% 20% 4% 22% 13% 13% 6% 11% 6% 6% 13% 11% 5% 13% 9% 9% 9% 7% 15% 17% 13% 24% 17% 9% 12% 9% 20%
Linearly polarized light C elegans GFP-mec4 TPEF SHG
Somatic DC potentials are attenuated in longer spines: The spine neck filters membrane potentials
Voltage divider: f(x)=1/(a+b*x) R = -0.53 Data: Data1_B Model: Roberto Equation: y=1/(a+b*x) Weighting: y No weighting Chi^2/DoF = 0.05427 R^2 = 0.28877 a 0.75887 0.21487 b 0.86152 0.38357
Uncaging response depends on spine neck length Top and Bottom quartiles of the distribution
Voltage divider: f(x)=1/(a+b*x) Weighting with StEr Data: Data1_B Model: Roberto Equation: y=1/(a+b*x) Weighting: y w = (data1_c) Chi^2/DoF = 0.00796 R^2 = 0.39976 a 0.73357 0.92866 b 0.84507 2.22223 R= -0.62
Two-photon calcium imaging: long spines activated by glutamate, but silent at the soma n = 5 n = 5 calcium voltage (>1.5 µm neck length) Long spines more prevalent in humans
2 mV 50 ms 1 mV 50 ms Why neck filtering?Role of spines in input summation
Spines linearize input summation spines: slope 0.97 0.01; shafts: slope 0.78 0.01; p<0.005, Mann-Whitney). Spines: slope 1.04 0.02; Shafts: slope 0.69 0.02; p<0.005, Mann-Whitney).
Summary: • Imaging of voltage in dendritic trees and spines • Imaging of action potentials invading spines • Spine neck filters membrane potentials in both directions from soma to spine: SHG from spine to soma: glutamate uncaging • Long spines are electrically silent • Spine electrically isolates inputs and implement linear summation of inputs