Download
1 / 10
100 likes | 109 Vues
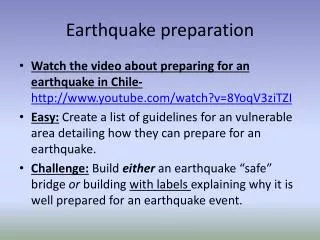
Chile’s earthquake in February was 8.8 on the Richter scale. It lasted for 90 seconds!. After news of the earthquakes earlier this year, we’d like you to make information leaflets warning people what might happen if there is one in the UK.

E N D
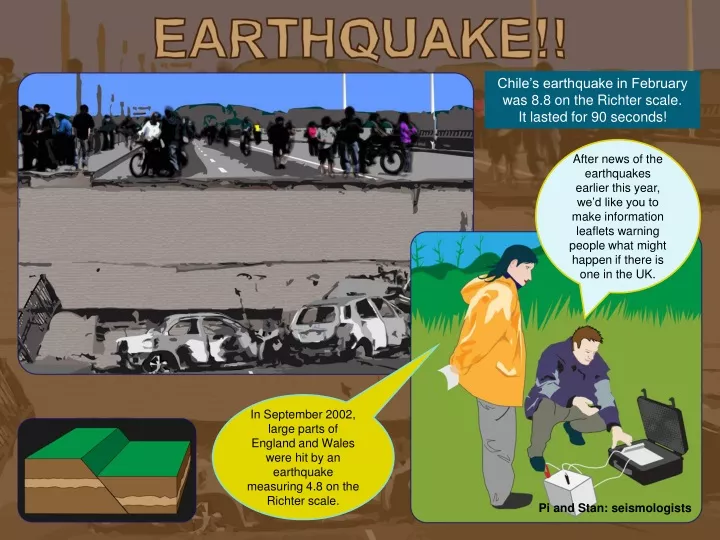
Chile’s earthquake in February was 8.8 on the Richter scale. It lasted for 90 seconds! After news of the earthquakes earlier this year, we’d like you to make information leaflets warning people what might happen if there is one in the UK. In September 2002, large parts of England and Wales were hit by an earthquake measuring 4.8 on the Richter scale. Pi and Stan: seismologists
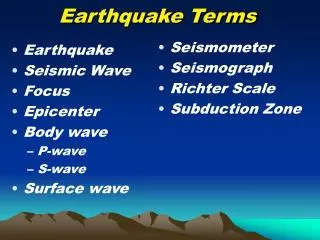
Where in the world do earthquakes happen most often?? Jamaica Chile California Russia Nepal Haiti Turkey Japan The red areas show where earthquakes are most likely to happen. However, earthquakes can occur in almost any area of the planet.
Every year, thousands of earthquakes happen all over the world. Earthquakes measuring less than 3.0 are not included because approximately 9 000 occur daily!
Up2d8 maths Teacher’s guide January and February of this year brought us the news of two earthquakes, the first in Haiti and the second in Chile. This issue looks at earthquakes in general and the maths that you can develop from this theme for example measurement including time and angles and also probability. You may find it helpful for the discussion part of this Up2d8 to refer to the following news articles about the two earthquakes earlier this year: Haiti detailsChile detailsHaiti and Chile For some background information about why earthquakes happen visit this site: BBC Schools
1st spread: Earthquake!! ● Ask the children if they think an information poster is relevant to the UK. Have they ever experienced one? Give the children some information about the earthquake in the West Midlands in 2002 and of others in the UK. You might find the details on this website useful: BBC News ● Before they design and make their leaflet, discuss the possible effects of an earthquake, relating it to any news they might have heard about what has happened in Haiti and Chile. You could include the following: immediate effects - people may be killed or injured, homes may be destroyed, transport and communication links may be disrupted, water pipes may burst and water supplies may be contaminated, shops and business may be destroyed, looting may take place, the landscape may be destroyed, fires can spread due to gas pipe explosions damaging woodland etc., there may be landslides and tsunamis which can cause major flooding. You could also include longer term problems e.g. the damage to transport and communication links can make trade difficult, disease may spread, people may have to be re-housed, sometimes in refugee camps, important natural and human landmarks may be lost. ● You could discuss the costs involved in bringing aid to a country and re-housing people. Make lists of the things the children think people would need in an emergency, make up some prices for each item and rehearse multiplication strategies for finding out the cost for one, three, five ten, 20 etc. people. You could focus on the tables you want to rehearse or some of the mental calculation strategies such as x15 by multiplying by ten and then adding half that amount. ●You could set some word problems around different numbers of people giving £50 or another figure and ask the children to work out amounts that might be raised. You could set a target amount to be raised e.g. for the school and work out how much each family would need to donate. You could give a UK target and find out how much per person, maybe the children could do some research on the population of the UK. …continued on the next slide
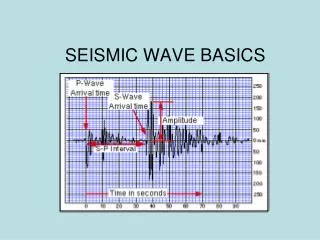
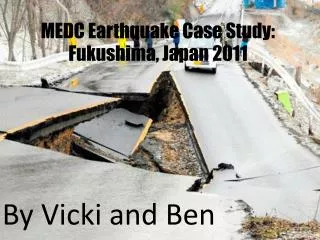
1st spread: Earthquake!! continued… ● You could ask them to define what should be in a survival cost for a person in an earthquake and cost it. ● Discuss the Richter scale and the fact that this is one of the ways to measure the size of an earthquake. The children could find out what the numbers mean and the relationship between them and the size of the earthquake in each category. ● Discuss the length of time the Chile earthquake went on for. You could ask the children to imagine how long 90 seconds is (and convert to minutes and seconds), putting their hands up when they think that amount of time has gone by. You could set up an experiment by asking them to build some form of structure out of cubes, card, bricks or something handy in the classroom and to put it in a box, shake it vigorously for that length of time and then look to see what has happened to it. If you wanted to bring in some shape and measurement why not give them specific 3D shapes to make to specific sizes? Or even get together in groups to make a village? ● You could repeat this for the length of the Haiti earthquake which lasted for 30-40 seconds and compare the lengths of times and the effects. ● You could ask them to work out how long these particular earthquakes happened to the nearest hour. ● Discuss what has happened to the road in the picture and link to the diagram below it. Try to set up an experiment to show what happens when the earth moves like this. You could use building blocks or make something like the one in the diagram using plasticine. Keep the two shapes together, place objects on the top and ask the children to predict what will happen when they move. You could use this as an opportunity to explore angles. Do they think the movement will cause as much damage at an angle of 90°/45° etc?. …continued on the next slide
1st spread: Earthquake!! continued… ● The children could draw their own diagrams to show the earth moving at different angles, measuring these accurately with a protractor. ● Discuss what they think might happen if this happened under the water leading into tsunamis. They could use a water/book tray or the sink to experiment with different amounts of water. You could be specific with the amounts that they use so rehearsing the skills to do with estimating and measuring capacities. ● Ask them to think about what would be important to put on an information leaflet and to work in pairs or a small group to make one to share with the class.
2nd spread: Where in the world do earthquakes happen most often? ● Look at the map of the world and ask the children to identify the countries mentioned on the spread. ● You could ask them to do some maths around these by exploring distances between their capital cities and London or a city near you, by looking at and comparing rainfall and temperature. These could lead to work which involves scale, converting from miles to kilometres and vice versa, plotting temperatures and rainfall on graphs and tables. ● On the actual map, identify the regions where earthquakes are most common and those that are least common. You could discuss probability and plot countries on a probability scale from least to most likely. ● This website gives a list of many of the more damaging earthquakes around the world which shows just how common they are: USGS earthquakes historical. You could plot some of these dates on a time line for this century and maybe do some calendar work, plotting the events on the actual days that they happened. Ask questions such as ‘Do earthquakes happen more often on a Friday, at night, in the summer, etc. Then compare the number of days/weeks/months between them. ● You could focus on the times that they happened and ask the children to find these times on analogue clocks and record as digital. Ask for time differences between pairs of them. ● You could do a similar activity for the deadliest earthquakes since 1900: USGS earthquakes deaths. You could give small groups of children a map of the world and ask them to plot these onto it to identify the common areas that they happen and compare with the map on the spread. …continued on the next slide
2nd spread: Where in the world do earthquakes happen most often? continued… ● You could ask the children to design an earthquake proof building. They should decide on the shapes to use, the measurements to construct with. They could draw their design first and then build it in 3D making shapes from nets or use art straws, lollypop sticks or similar items. Encourage them to be imaginative, their design doesn’t have to be practical from an engineering point of view, they could make rings or hoops on the roof so that giant birds can lift it off the ground before the earthquake does serious damage! Younger children could build them with multi-link cubes, clixi or similar and think of some imaginary ways they can be saved to share with the class. ● This website has some interactive word problems relating to earthquakes that the children in KS2 could answer: FEMA
3rd spread: Every year there are thousands of earthquakes happening all over the world ● Using the table on the spread you could ask questions such as: 1. In a given year, how many earthquakes measure 6.0 or greater? 2. In a given year, what percentage of earthquakes measure 3.0 or greater are moderate? 3. Calculate the percentage of earthquakes that measure 5.0 or greater that are classified as “major” and “great.” • This website gives information about the types of damage caused by earthquakes of • different sizes: Matter.org.uk ● You could ask the children to research some of the more famous earthquakes and make up a fact file about them.